
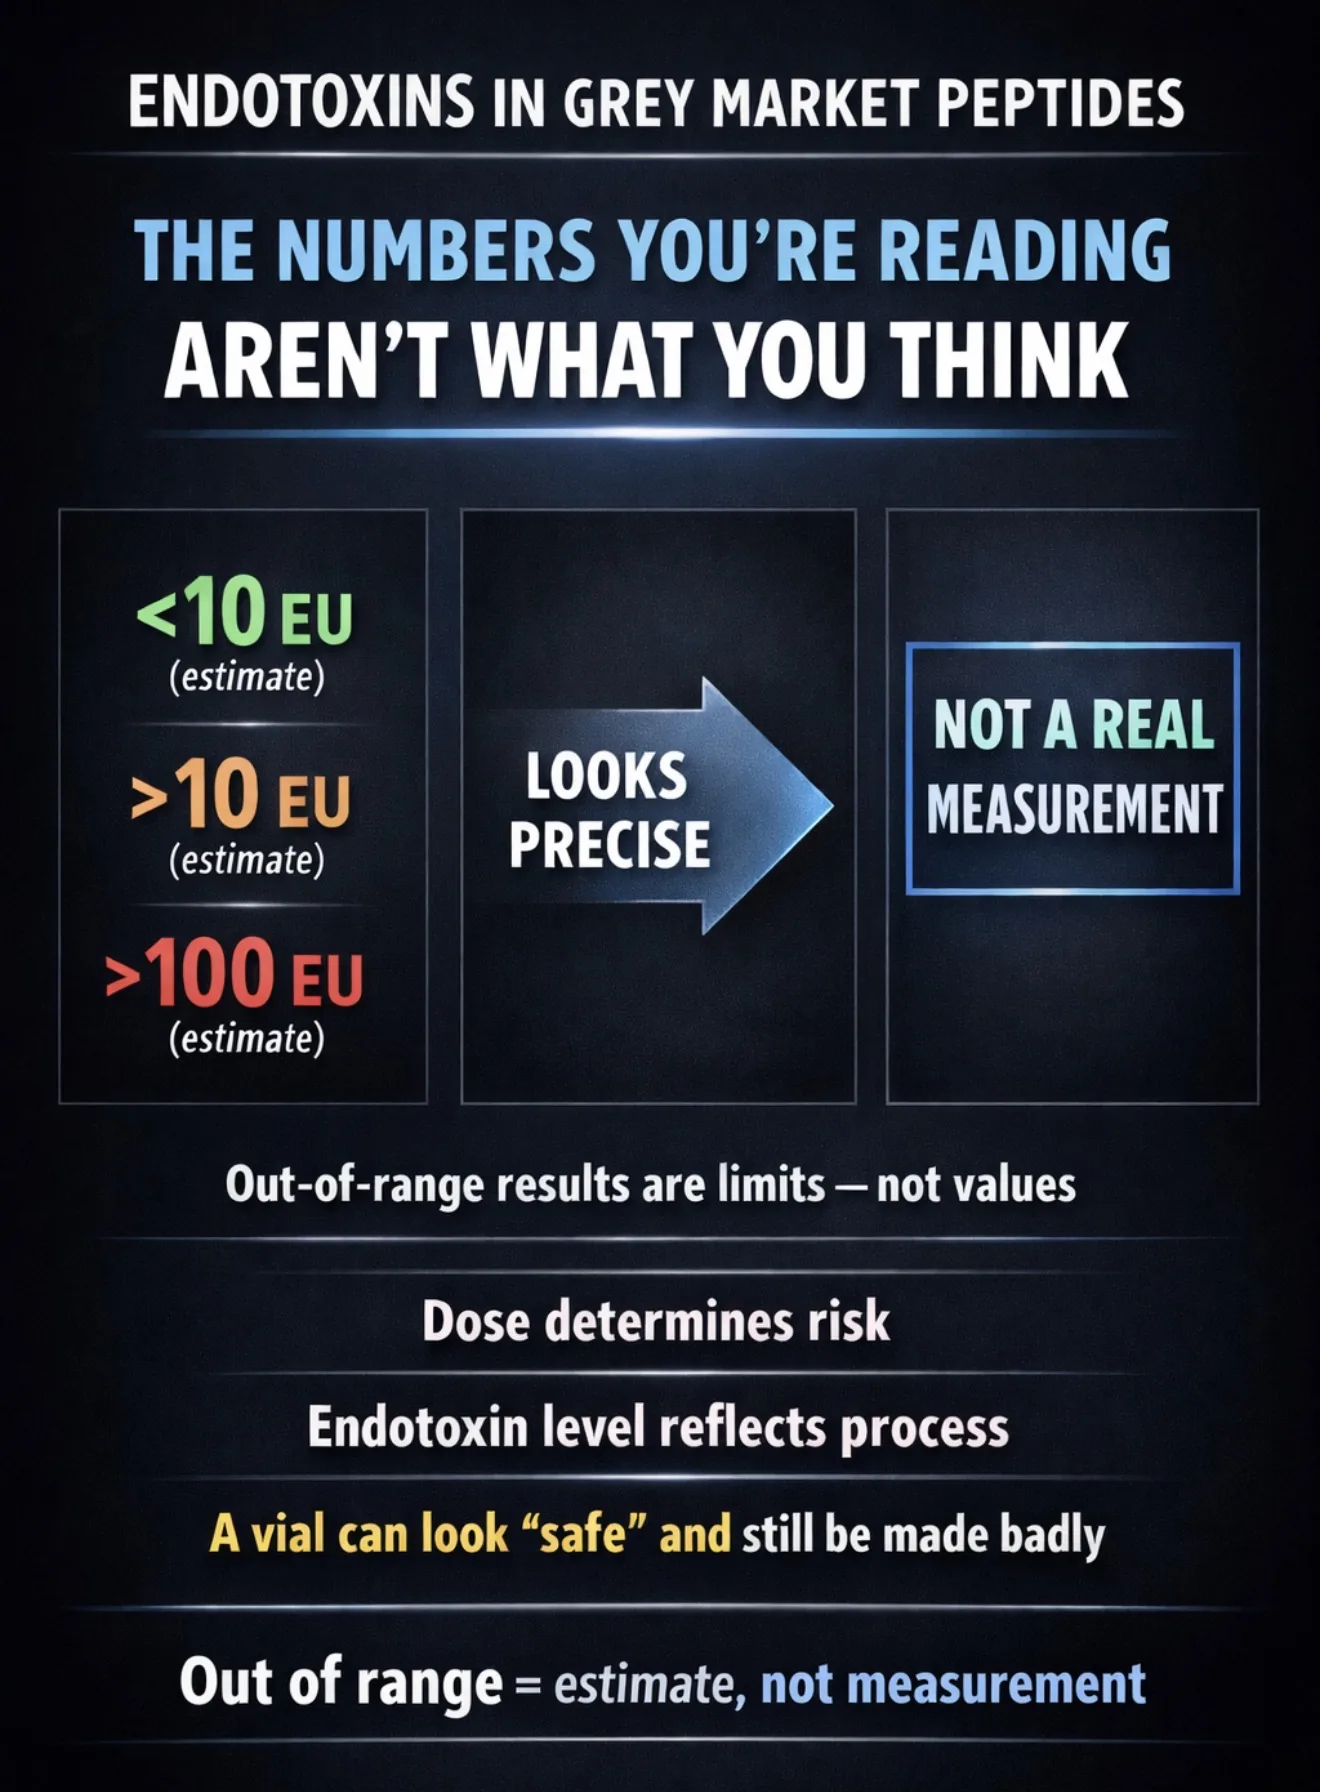
With more samples now being tested for endotoxins, and with some very high numbers being reported, there is understandable confusion around how accurate these results are and how they should be interpreted.
I’ve decided to take a deeper dive into endotoxins.
Having not been particularly bothered about sterility or endotoxin testing of my own personal samples before, once I started reading more about endotoxins, I realised this is a more nuanced issue than I had first thought.
Starting with the Basics
Endotoxins are separate from sterility.
Sterility testing looks for live bacteria
Endotoxin testing looks for bacterial fragments (LPS)
Endotoxins are toxic lipopolysaccharides found in the outer membrane of Gram-negative bacteria, such as E. coli. They can remain in products even when viable bacteria have been killed.
Although endotoxin exposure is common in the environment, for example in house dust, parenteral administration changes the situation completely. Injection bypasses mucosal and gut barrier systems, meaning the dose response and clinical significance differ substantially compared to environmental exposure.
Recombinant products made in E. coli are well known to carry endotoxin risk. LPS is widely recognised as a persistent downstream processing challenge, and its removal can be technically difficult.
Most of our peptides, however, are produced by SPPS, which does not involve a bacterial culture step. That said, endotoxin can still enter the product via:
water systems and aqueous processing steps
inadequate cleaning
non-depyrogenated glassware and filling components
environmental contamination
lyophilisation, handling, and vacuum processes
Endotoxins themselves are released when bacteria die or disintegrate.
Two Separate Issues That Need to Be Addressed
When discussing endotoxins, there are two distinct questions
1.What effect do endotoxins have on the body?
2.What does their presence say about the manufacturing process?
These are related, but they are not the same issue.
Clinical Effects
Acute effects include pyrogenic reactions and sepsis like symptoms such as:
fever
chills / rigors
malaise
headache
myalgia
At higher levels, rapid cytokine release can also lead to:
tachycardia
hypotension
Local effects are also possible. LPS is a potent activator of the innate immune system via TLR4, driving local inflammation. This can plausibly contribute to injection site reactions as well as broader inflammatory symptoms.
Endotoxin as a Marker of Manufacturing Quality
The presence of endotoxins is also a sign that the manufacturing environment was not clean.
Even where an acute dose may not be high enough to cause an immediate pyrogenic reaction, endotoxins still matter because they indicate:
poor water quality control
poor cleaning
contamination during handling or filling
weak process control overall
So endotoxin is not just a dose issue. It is a direct reflection of how clean the manufacturing process actually was.
In synthetic peptide production, endotoxins can enter the product through:
water systems
equipment
handling
filtration and filling steps
lyophilisation processes
Interpreting Endotoxin Results
The other issue with endotoxins is how results are reported.
Values such as:
<10 EU/vial
>10 EU/vial
>100 EU/vial
often appear with an accompanying numerical estimate.
At first glance, these look like proper measurements. In reality, they often are not.
Quantitative endotoxin testing is only valid when the unknown sample falls within the calibrated range of the assay being used.
Endotoxin levels are typically measured using the bacterial endotoxin test (BET), most commonly via LAL-based assays (Limulus Amebocyte Lysate) or cartridge-based systems such as Endosafe.
These tests detect endotoxin through a biological reaction that produces a measurable signal.
The assay is calibrated over a defined range, which is why results become unreliable when the sample falls outside that range.
That range matters because the test is only designed to measure accurately within certain limits. If the sample contains more endotoxin than the assay can measure properly, the signal begins to saturate. If it contains too little for that assay range, the signal becomes weak and less precise.
In both situations, the assay is no longer producing a robust quantitative result.
This is not a limitation of a specific lab, but of the assay itself. Any endotoxin test will only produce reliable quantitative results when the sample falls within its validated range.
Much of the current confusion comes down to assay selection, using a range that does not match the sample leads directly to unreliable results.
People see something like:
>10 EU/vial (11.43 estimate)
and assume that means the sample contains roughly 11.43 EU/vial.
But that is not what it means.
What it actually means is:
the endotoxin level was above the upper limit of that assay, and the reported number is only an approximation generated outside the assay’s validated range.
The same problem can happen at the low end. A result such as:
<10 EU/vial (0.402 estimate)
may look extremely reassuring, but if the assay is operating near the lower edge of what it can resolve well, that number may still lack precision.
So the problem is not just that results can be too high to measure properly. They can also be too low for that particular range to measure robustly.
In practice, this means that out-of-range values should not be treated as if they are exact measurements.
They should be treated as:
a sign that the sample exceeded the useful limits of that assay
and an indication that the sample needs to be re-tested under the correct conditions, usually with a different dilution or assay range
Proper endotoxin testing requires either selecting the correct assay range in advance, or adjusting the sample through dilution so the result falls within the validated range.
This matters because examples show that once samples are re-run properly, the final result can be substantially different from the original estimate.
In some cases, the first reported estimate has turned out to be many times lower than the correctly quantified endotoxin level ( examples coming later)
So the issue is not simply that the numbers are a bit rough. It is that they can give a false sense of precision.
And once those estimates start circulating publicly, they are very easily mistaken for real, validated measurements.
The basic equations are:
If reported as EU/vial:
EU per dose = EU/vial × fraction of vial used
If reported as EU/mg:
EU per dose = EU/mg × mg injected
And:
EU/vial = EU/mg × total mg in vial
The Pyrogen Threshold (What Actually Matters for Dose)
For injectable products, the commonly referenced limit is:
5 EU/kg (per hour for IV exposure)
So roughly:
50 kg → 250 EU
70 kg → 350 EU
80 kg → 400 EU
This is the approximate level where pyrogenic reactions, such as fever and chills, become likely.
Putting it together
A vial might contain a high total endotoxin load, but:
if only a small fraction is injected
the actual EU per dose may still be well below this threshold
However, even if the actual dose per injection is not especially large, a high endotoxin level is still significant because it tells you something about the process behind the vial.
In other words, endotoxin is not only about whether a single injection crosses some immediate reaction threshold. It is also about what that result says about the manufacturing cleanliness.
Why <10 and >100 Results Break the Data
Case 1 T60 Sample
The first test was performed using the 0 to 10 EU/vial assay.
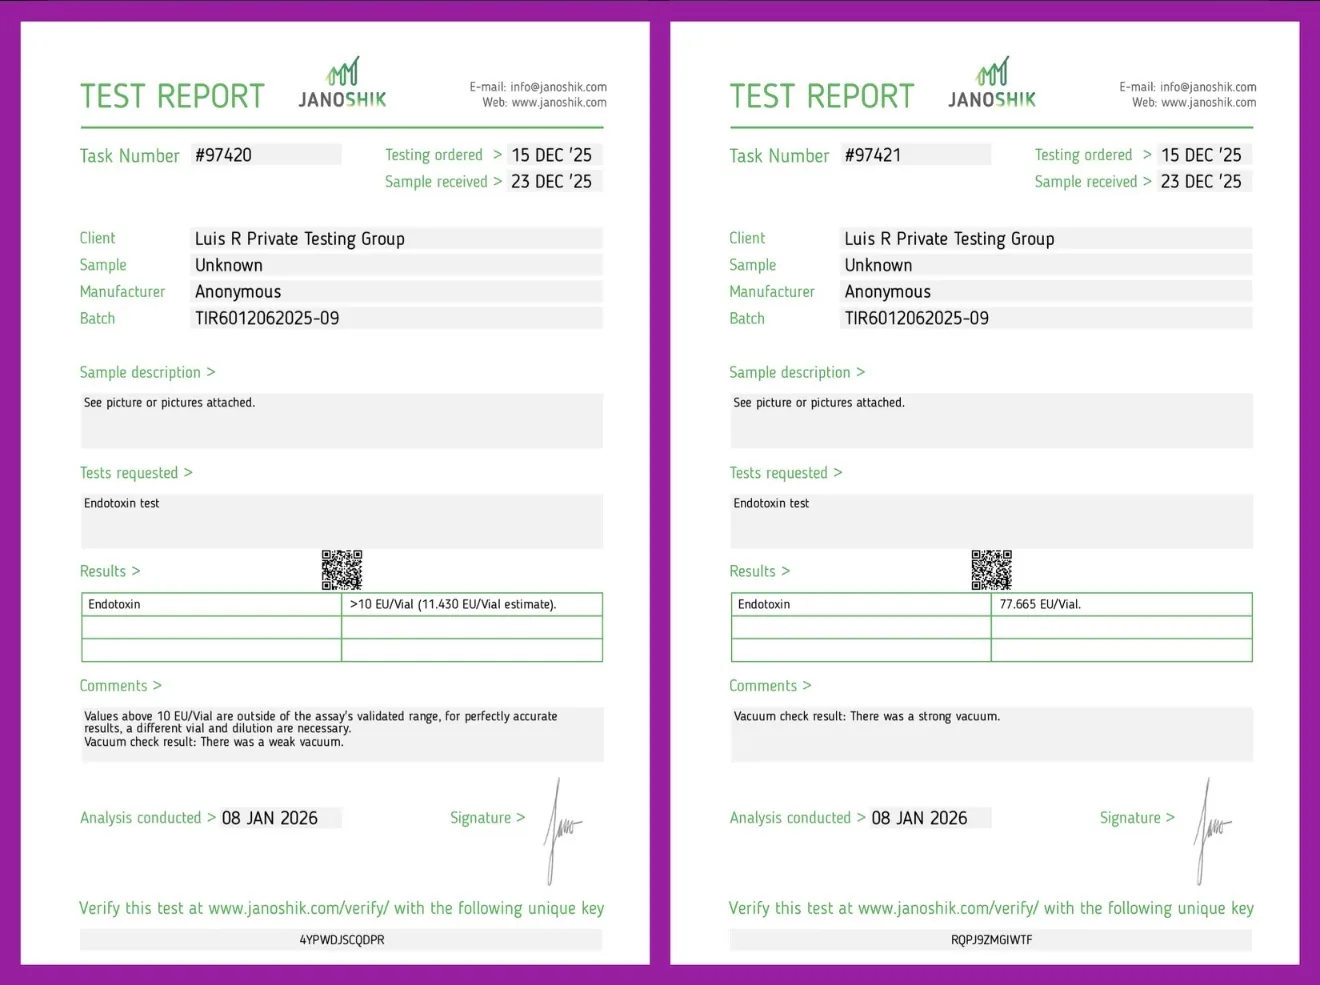
Because the actual endotoxin level was above the validated range of the 0 to 10 EU/vial assay, the result was reported as:
>10 EU/vial (11.430 EU/vial estimate)
This was not a true quantitative measurement. It was only an estimate generated outside the assay’s validated range.
When the same sample was re-tested using the 0 to 100 EU/vial assay, the result came back as:
77.665 EU/vial
This shows that the first assay was not appropriate for the level of endotoxin present as it was already outside the range in which that test could measure reliably.
The second test, using the higher assay range, brought the sample into a valid measurement window and produced a properly quantified result. That result was substantially higher than the original estimate.
Case 2 NAD 500 mg Sample
In this case, the first result was reported as:
>100 EU/vial (134.750 EU/vial estimate)
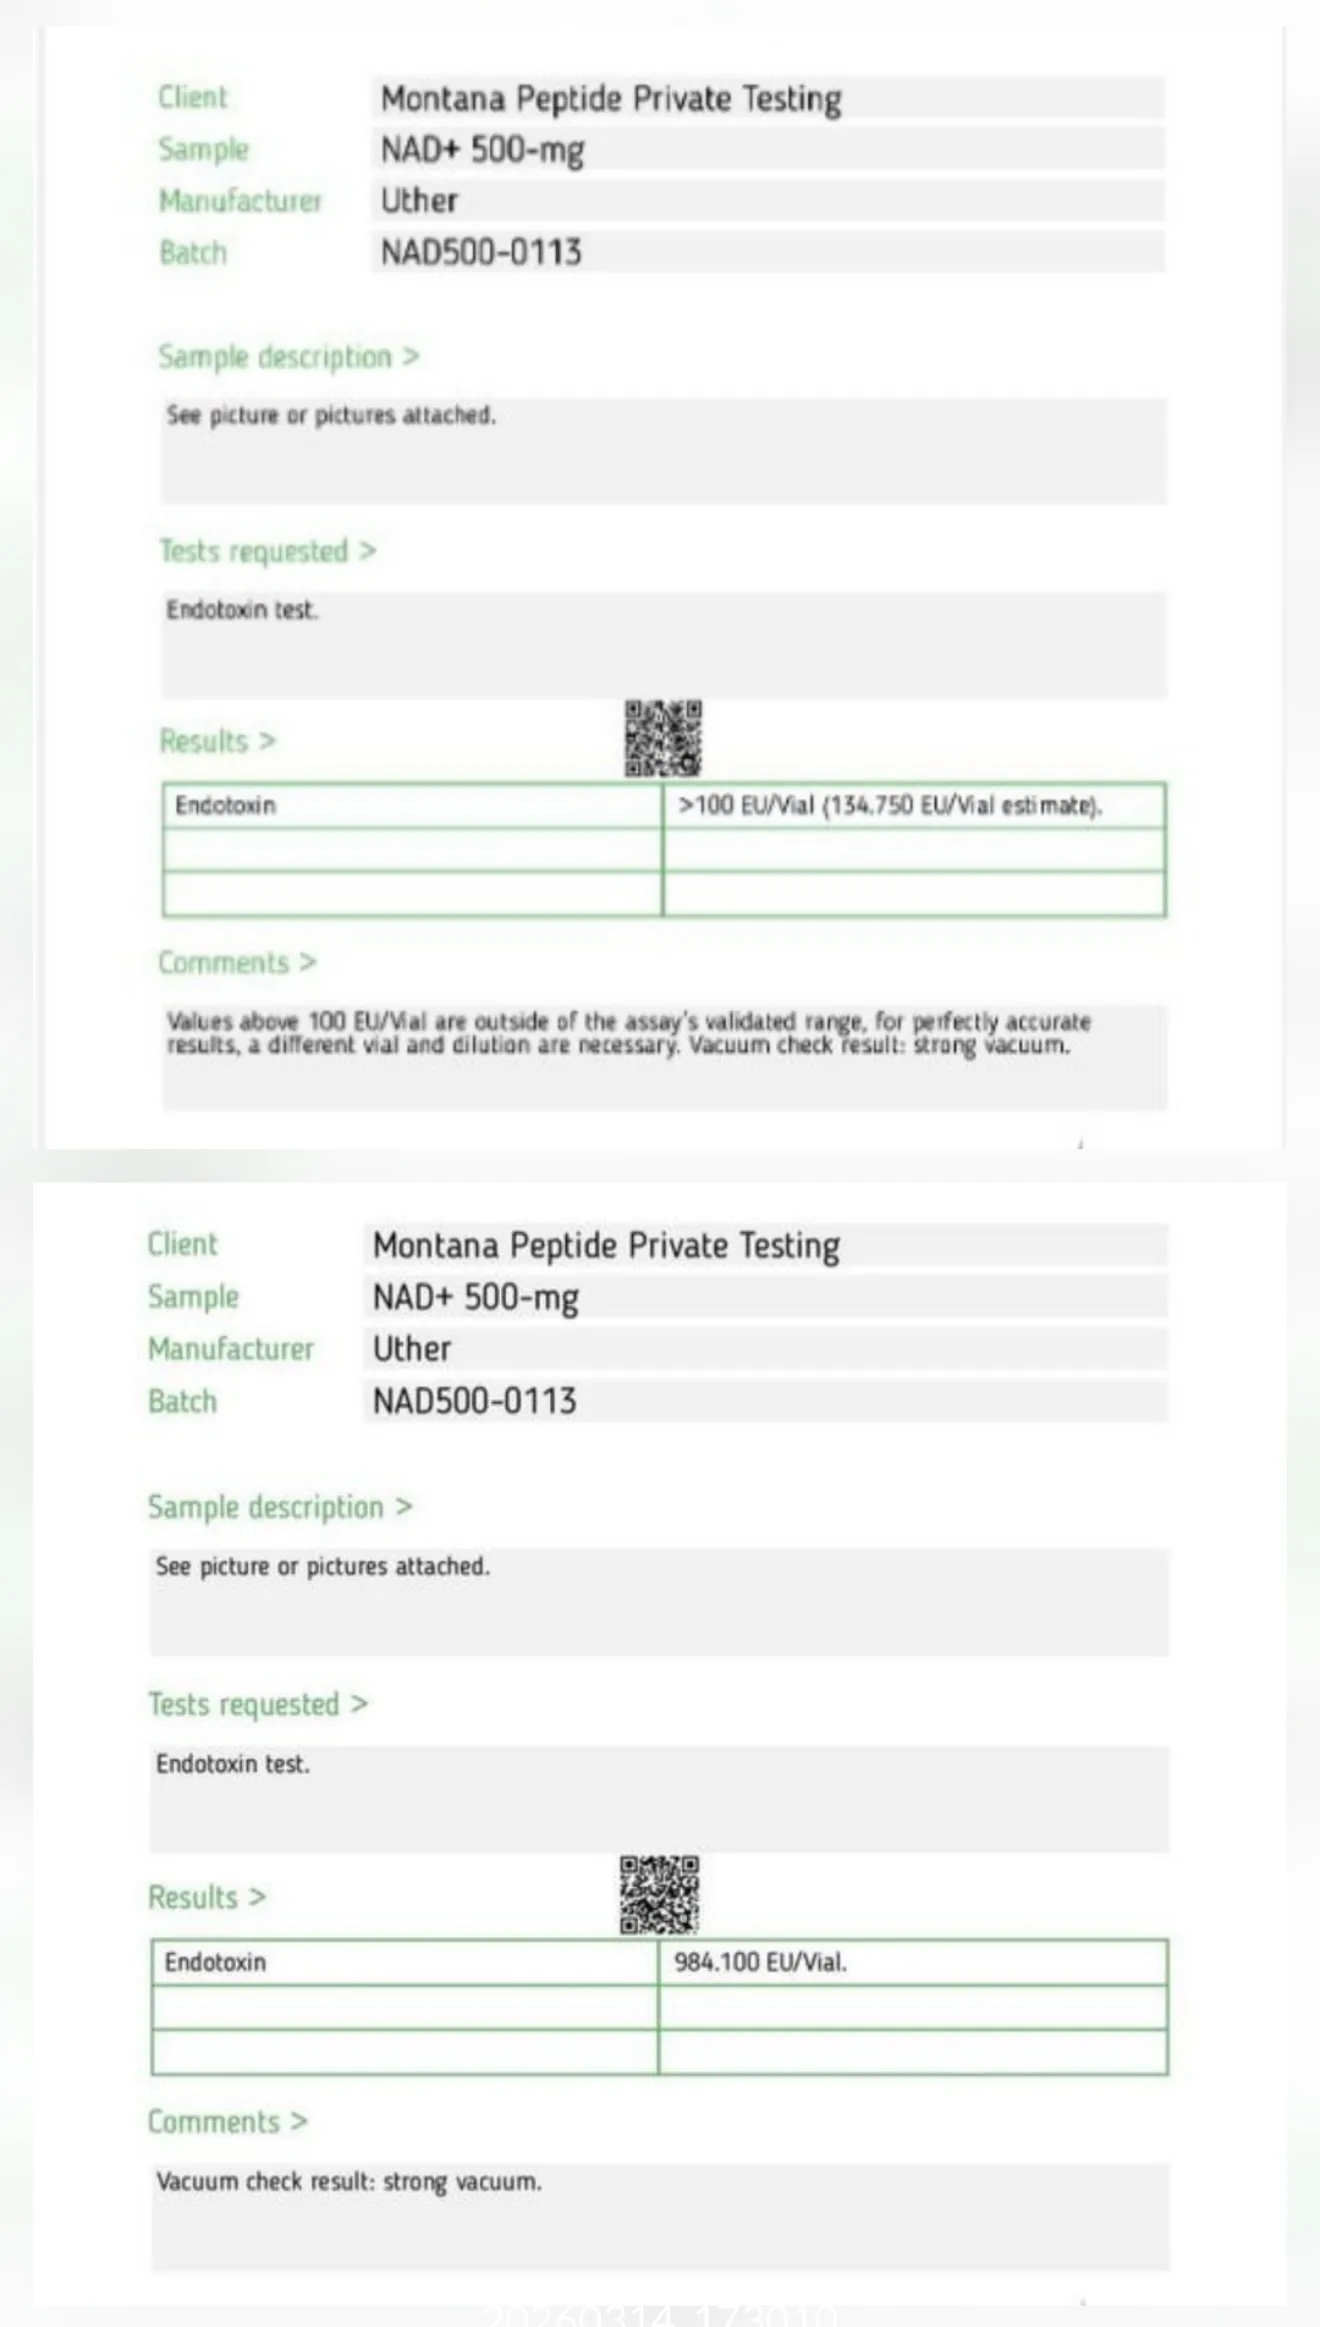
When the test was repeated under the correct conditions, the result came back as:
984.100 EU/vial
This is approximately 9× higher than the original estimate.
Case 3 Sample
The first result was:
<10 EU/vial (0.402 EU/vial estimate)
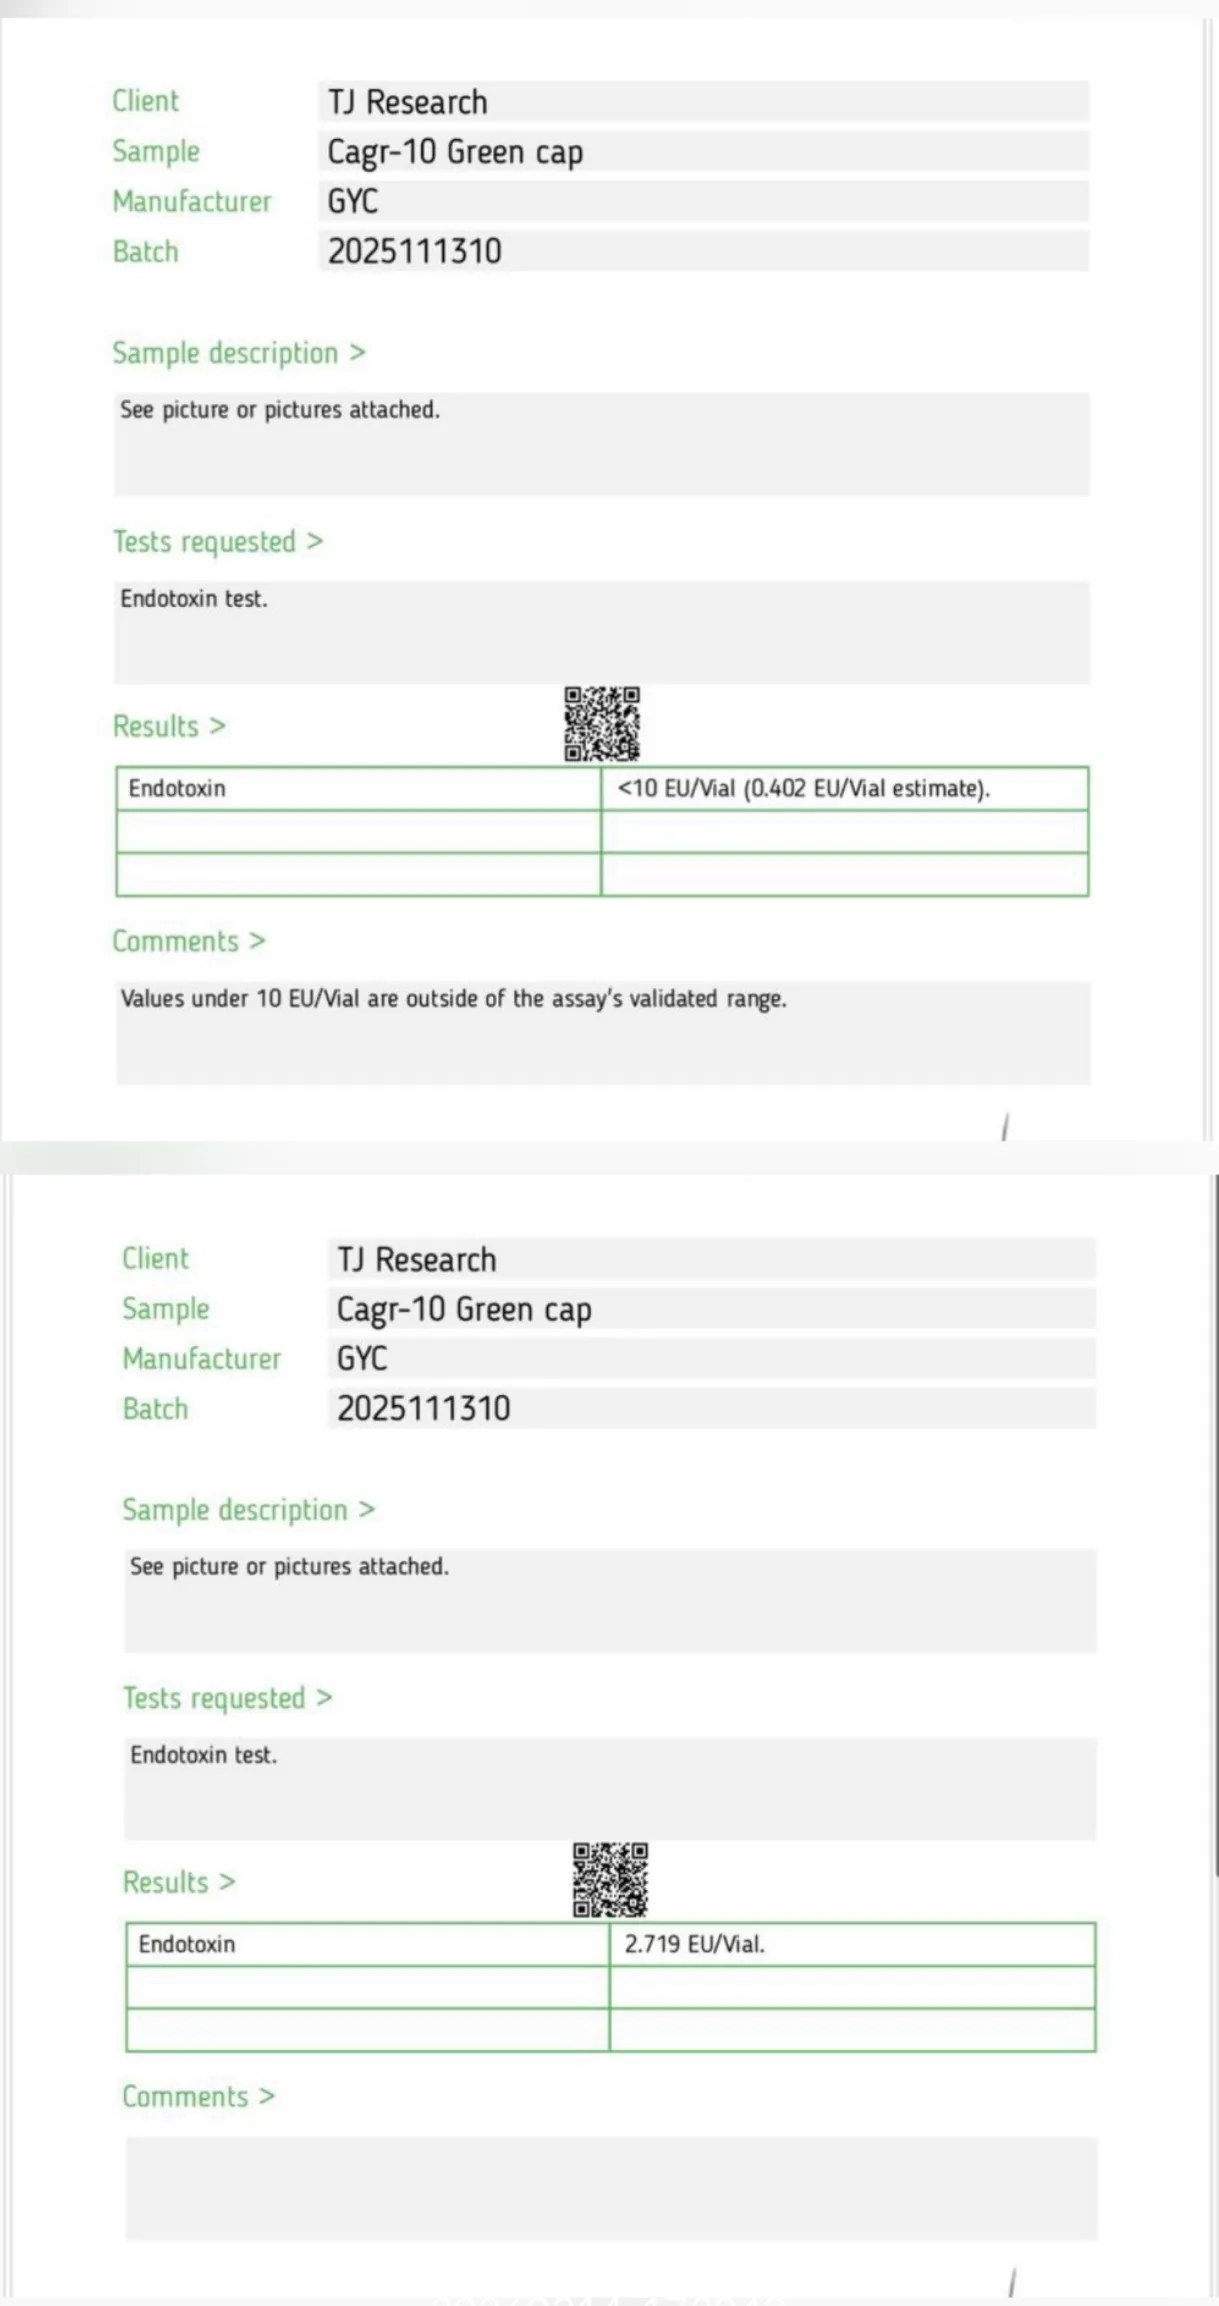
When repeated, the result came back higher at:
2.719 EU/vial
Although both values are within the same general range, this still demonstrates that low-end estimates are not robust measurements, particularly when close to the lower detection limit.
Case 4 T60 Sample
The initial test was performed using the lower-range assay and reported as:
>10 EU/vial (14.165 EU/vial estimate)
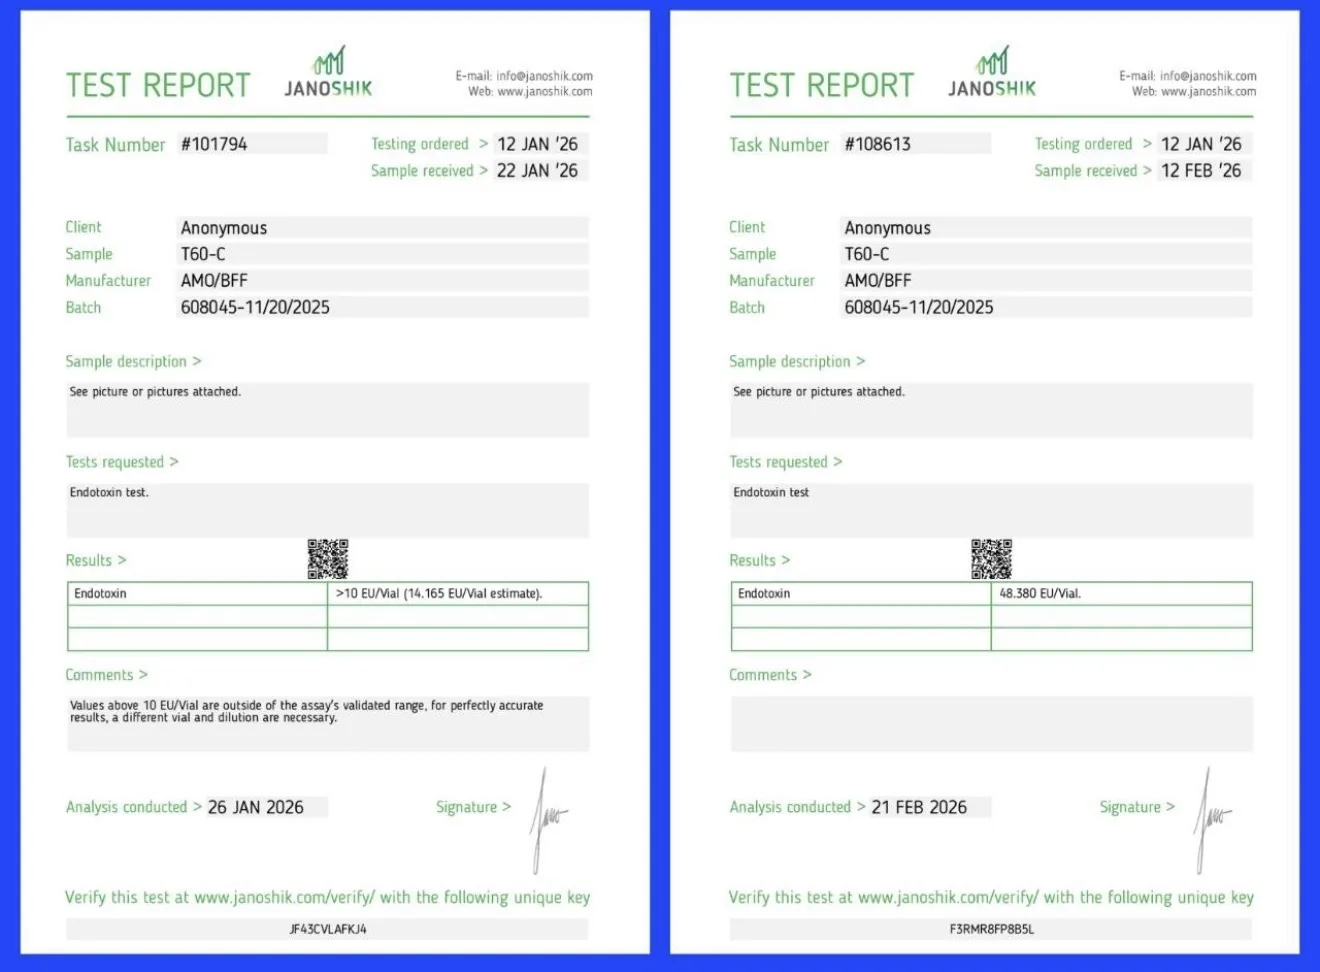
When the same sample was re-tested using a higher-range assay, the result came back as:
48.380 EU/vial
This confirms that the original estimate significantly understated the true endotoxin level.
The second test, by bringing the sample within a valid range, provided a properly quantified result, and revealed that the actual endotoxin level was substantially higher than initially indicated.
It is also important to recognise that endotoxin levels can vary between vials from the same batch, meaning a single result may not represent the entire batch accurately.
How Common Is Endotoxin Contamination in Practice?
According to Finnrick: Out of their samples tested through January 2026
8% of the grey market peptide samples tested show quantifiable endotoxin levels above trace amounts.
So while not universal, endotoxin contamination is clearly not rare, and is measurable in real samples.
They went on to say that
Nearly 63% of samples tested for endotoxins were found to contain none at all
29% produced a response from the test, showing small quantities present, but below the limit of quantification
Nearly 8% of samples were found to contain more than the limit of quantification, meaning a detectable, quantifiable amount, even if not necessarily outright dangerous
This matters because it shows three distinct groups;
1.No detectable endotoxin
2.Trace level endotoxin present, but too low to quantify properly
3.Quantifiable endotoxin contamination
It’s the third group that matters most for this discussion.
What The Wider Endotoxin Data Suggests
I also came across a broader compilation of endotoxin results someone else put together from STG and FPPG endotoxin tests over the last 12 months.
This is not a formal published database, and it is not my own analysis. It appears to be a community compiled summary built from posted test results over that period. Even with that limitation, it still offers a useful high level picture of how endotoxin findings have been showing up across vendors and across time.
1. Vendor results are not uniform.
Endotoxin Levels by Vendor (EU/mg): A 12-Month Snapshot
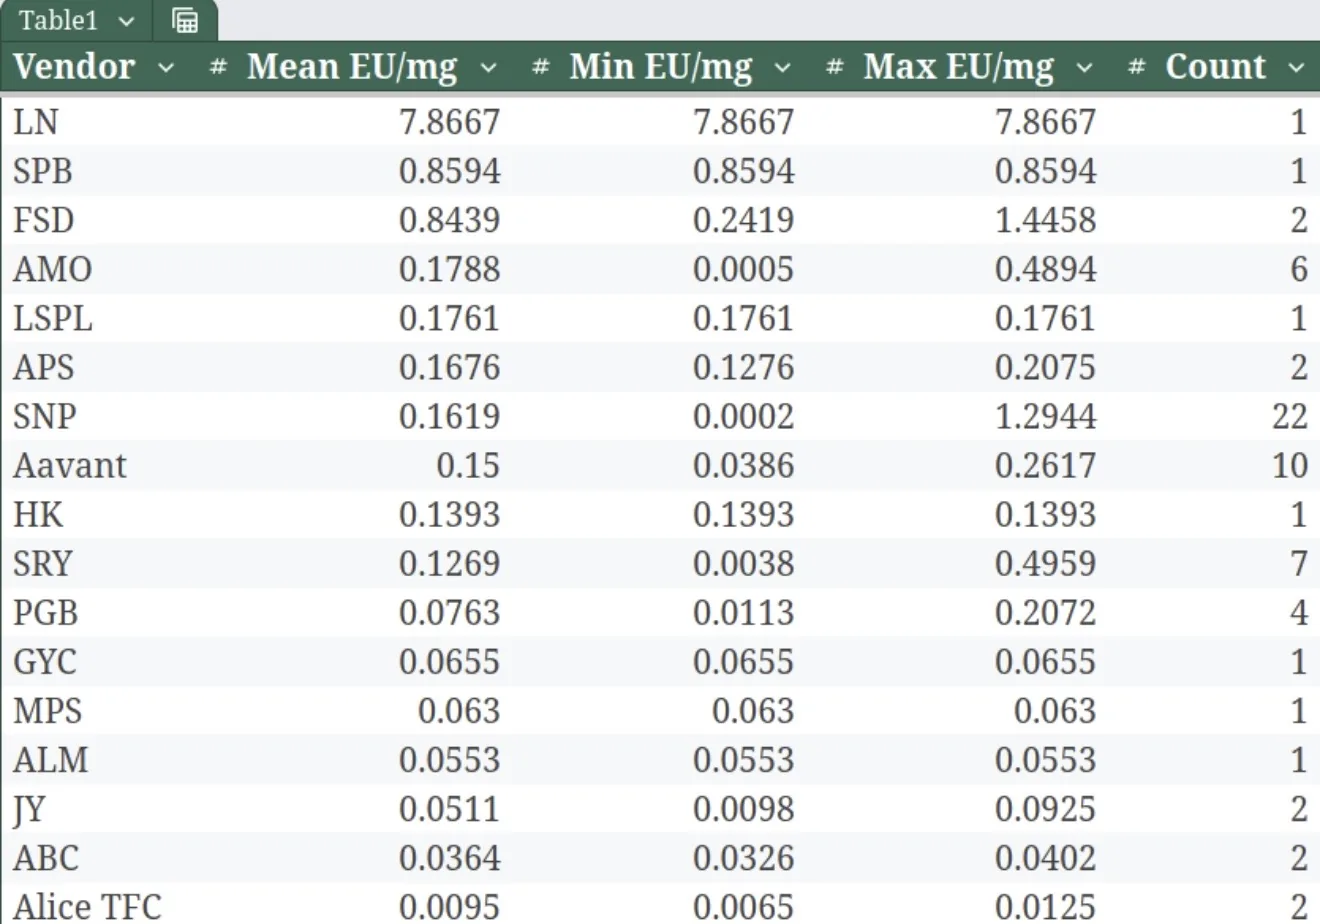
The first table compares vendors by:
mean EU/mg
minimum EU/mg
maximum EU/mg
test count
That matters because endotoxin findings are not evenly distributed across suppliers.
Some vendors sit consistently low. Others show higher averages, or a wider spread between their lowest and highest results. That does not automatically make a lower average vendor “safe,” or a higher average vendor inherently dangerous. Some vendors have only a small number of tests, and single outliers can skew the picture.
Still, the overall pattern suggests endotoxin contamination is not just random background noise. Some suppliers appear to show it more often, or with greater variability, than others.
2. The monthly breakdown matters just as much as the vendor averages
Monthly Endotoxin Levels: Where Spikes Actually Occur
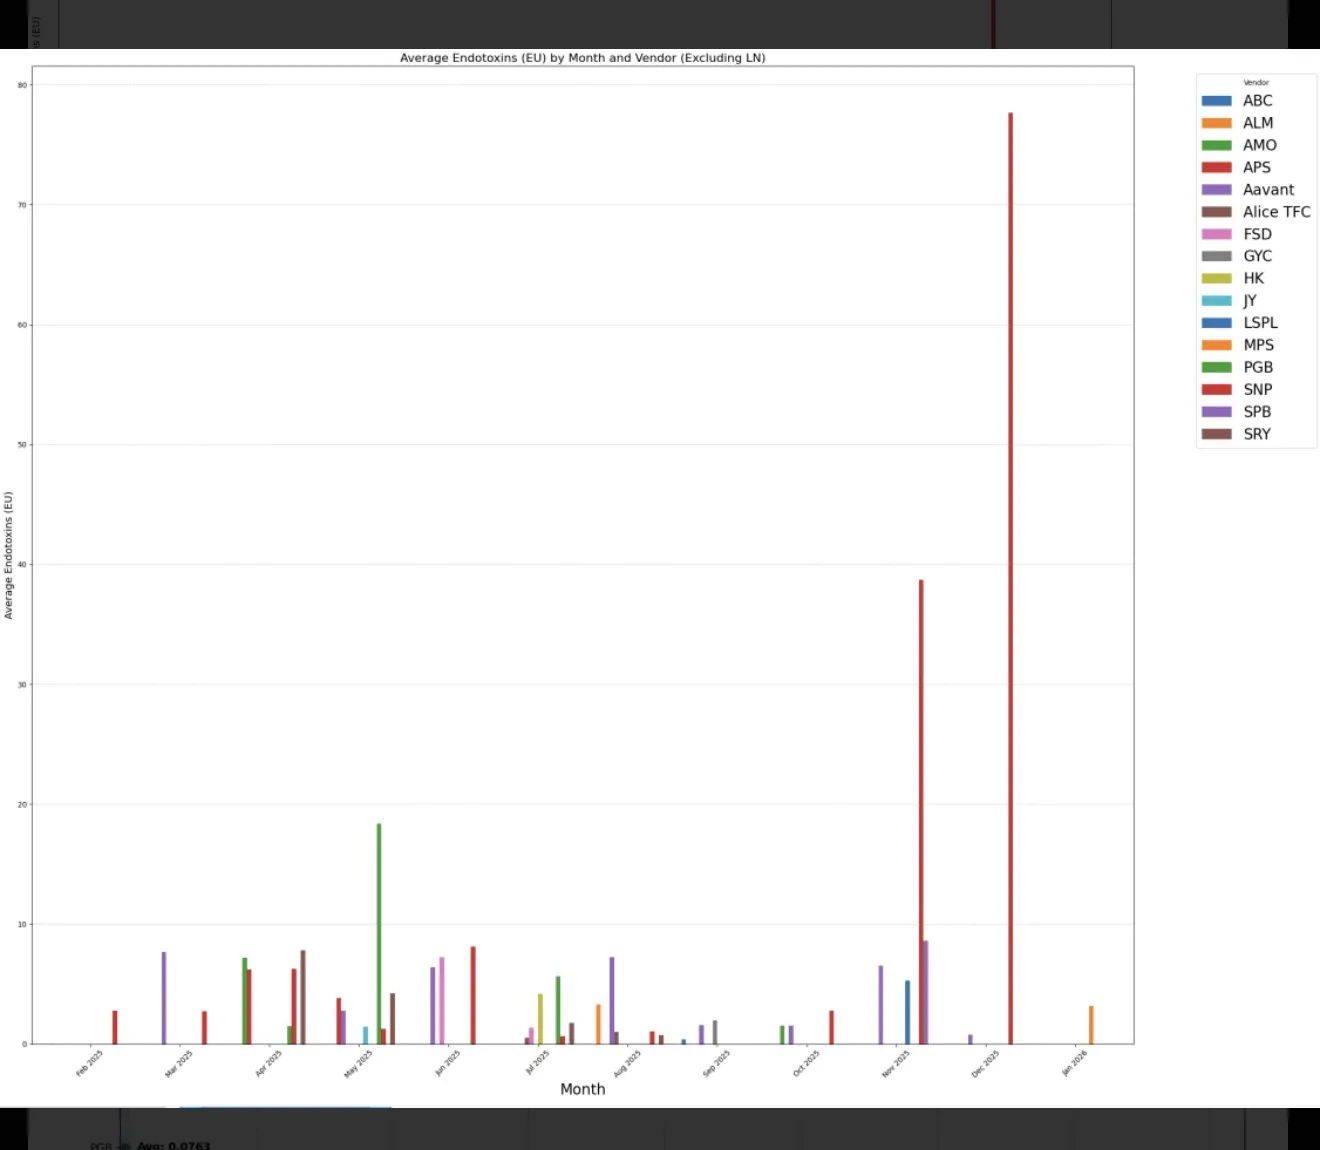
This chart displays average endotoxin levels (EU) by month, broken down by vendor over a 12-month period (excluding LN results).
Each coloured bar represents a different vendor, allowing you to see how endotoxin levels:
change over time (month-to-month)
vary between vendors
and whether results remain stable or show sudden spikes
Most months show relatively low average endotoxin results. However, higher values appear in April, May and June 2025, with further increases in November, and a particularly large spike in December 2025. Outside of these periods, results generally sit closer to baseline levels.
How to Approach Endotoxin Results
When reviewing a result:
Is it within the assay’s validated range?
Is it reported as EU/vial or EU/mg?
Has it been confirmed with repeat testing if out of range?
Does it reflect a one-off result or a consistent pattern?
Endotoxin testing is not just about getting a number.
It is about understanding whether that number was measured within the correct conditions, what it actually represents, and what it says about both dose and process.
Without that context, the number alone is not meaningful.
Comments