
TL;DR: SteriGenix’s public COA chromatograms were generated from report information, not HPLC detector data. Supporting packets also contained template wording and vial weights that weren’t measurements of the submitted samples.
Some results closely matched independent labs; others showed quantity differences or conflicting identity findings. That doesn’t prove every result was fabricated, but it leaves the underlying testing unresolved.
New orders remain paused, with SteriGenix citing payment-provider loss and an ownership transfer. Its operators and relationship to payment recipient HBF Group remain unclear. The missing answers are the original instrument records and who is accountable for the testing.
What a chromatogram is supposed to show
A chromatogram is meant to show what happened during an HPLC test. As the sample moves through the system, a detector records a signal over time. Those readings are then plotted as a graph. The peaks on that graph are supposed to reflect what the detector recorded during the actual test. For a customer, none of the technical work behind that graph is visible. They simply open their SteriGenix COA and see the finished chromatogram sitting underneath the purity, identity and content results. It would be natural to assume that graph had come from the HPLC test itself. But that’s not how SteriGenix’s public reporting system produced it.
What was happening when someone opened a COA
When a customer opened a SteriGenix report on the website, their browser received the stored details for that report: things such as the product name, batch or access number, reported purity, the components in the product and the test date. The website also sent the customer’s browser the programming needed to display the page. This is normal for modern websites. Your browser routinely downloads JavaScript so that pages can create charts, menus and other interactive elements.
Hidden inside the JavaScript used by SteriGenix’s public report pages was the code responsible for drawing the chromatogram. Customers didn’t see a button saying “generate chromatogram.” They simply saw the finished graph. The code ran automatically in the background when the report was displayed.
The unusual part wasn’t that this website code was accessible. Front-end JavaScript has to be sent to a visitor’s browser in order to run, so it can normally be inspected and preserved. The unusual part was what the code was doing. It didn’t take detector readings from the HPLC test and plot them. Instead, it took information already stored in the report and used that information to create the graph itself.
The same report produced the same graph every time
The graph-making code was deterministic. That means that if it was given the same report details again, it produced the same chromatogram again. So the process worked essentially like this:
product + batch + reported purity + components → website code → chromatogram
The same report information therefore produced the same peaks, the same smaller peaks and the same background pattern every time the COA was loaded. That explains why a customer could reopen the report days later and see what appeared to be the same analytical chromatogram. The same graph appeared each time the online COA was opened, not because the website was displaying a saved graph from the HPLC test, but because the website generated the graph again from the same report details. The website generated a different-looking chromatogram according to the details of each report. But give it the same report details again, and it generated exactly the same graph again.
How this was discovered
Concerns about SteriGenix didn’t begin with the website code. A high-volume customer had already been questioning the lab about its methods, its endotoxin results and the supporting data it was providing. The source later said they had become suspicious relatively early and had begun conducting wider due diligence on the operation.
Sterigenix’s website files were saved and examined. In those files, the code that actually drew the chromatogram was found. That meant the graph could be tested properly. Instead of just saying the chromatograms looked suspicious, the same code could be run on its own to see whether it could recreate the graphs from the reports.
Recreating the original chromatograms
Twenty original SteriGenix chromatograms had been preserved well enough to make a direct comparison. For each one, the same information from the SteriGenix report was entered into the preserved graph-making code. No HPLC detector readings were supplied. No original time/intensity data, raw instrument files or peak tables were used. The code was given only the report information it had been designed to use.
It recreated all 20 published chromatograms exactly.
The newly generated traces contained the same major peaks, the same smaller peaks and the same baseline fluctuations. At the underlying graphical level, each contained the same 1,400 plotted coordinates. The coordinate difference was zero and the underlying path hashes were identical.
That is the central technical finding of this investigation.
Try the renderer yourself
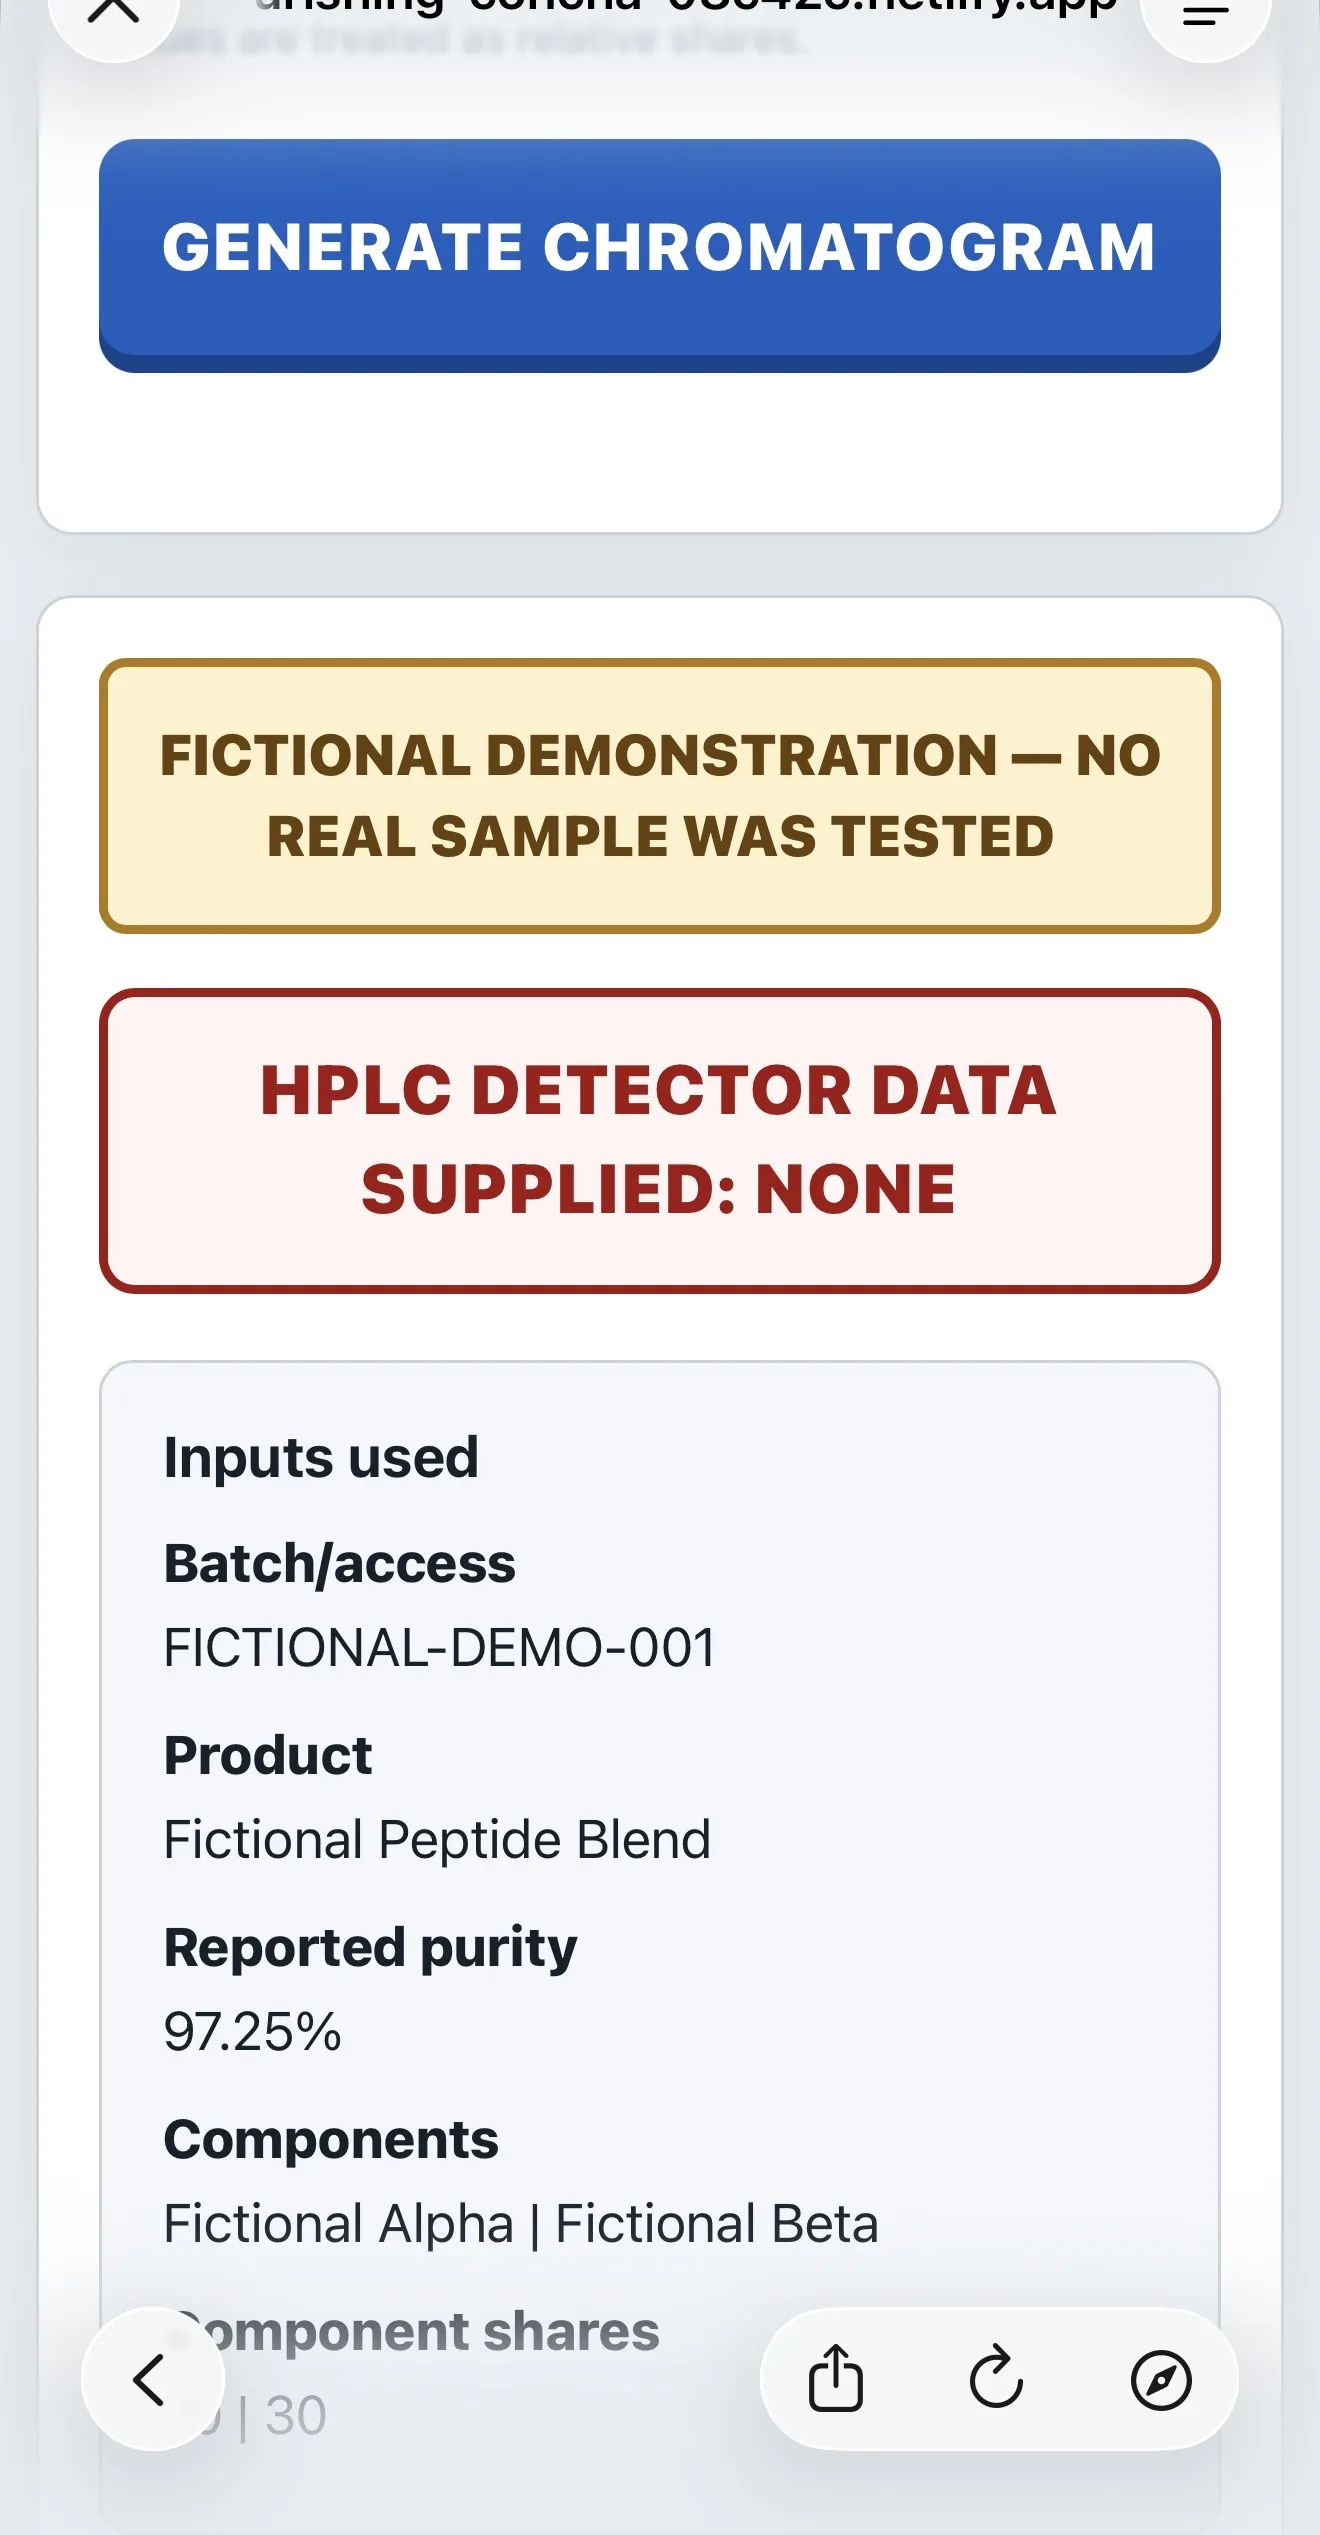
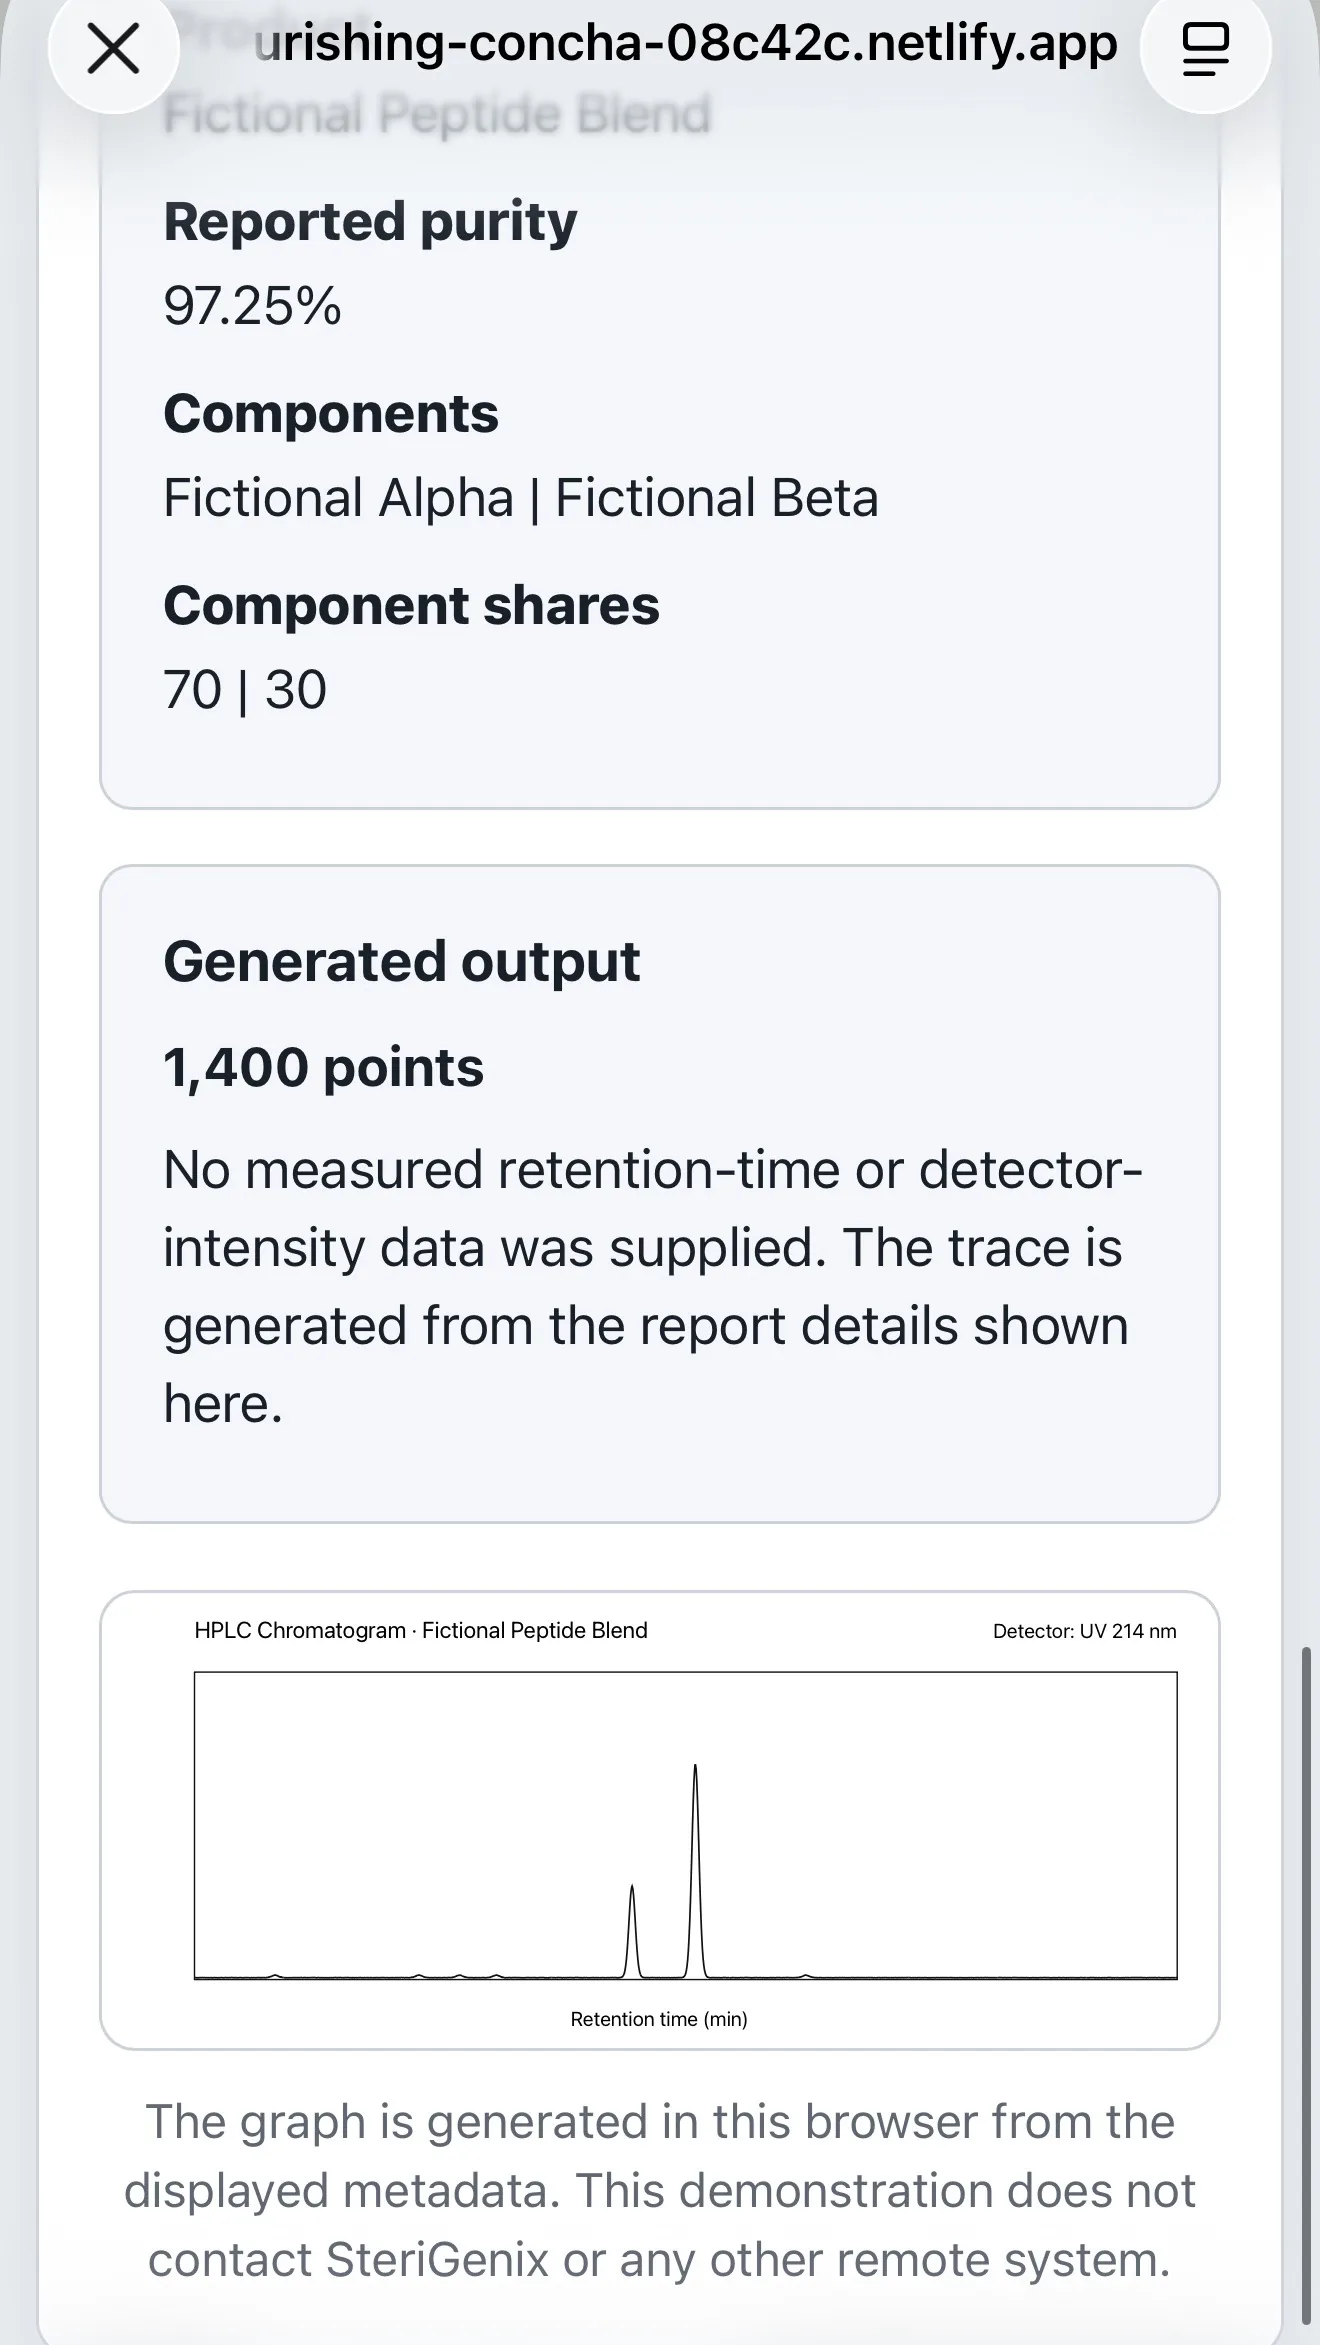
I’ve also made an interactive version of the preserved SteriGenix chromatogram renderer so readers can see what the code does for themselves.
The demonstration does not connect to SteriGenix and does not use any HPLC detector data. You can enter a product name, batch number, reported purity and components, even completely fictional details, and the preserved rendering logic will still generate a chromatogram.
The fictional mode is clearly labelled “No real sample was tested” and “HPLC detector data supplied: NONE.”
Try the interactive chromatogram demonstration
The demonstration shows that SteriGenix could produce the chromatogram shown on a COA without using any measured HPLC detector data at all. That means the graph itself wasn’t proof of the test it appeared to represent.
What the code actually used
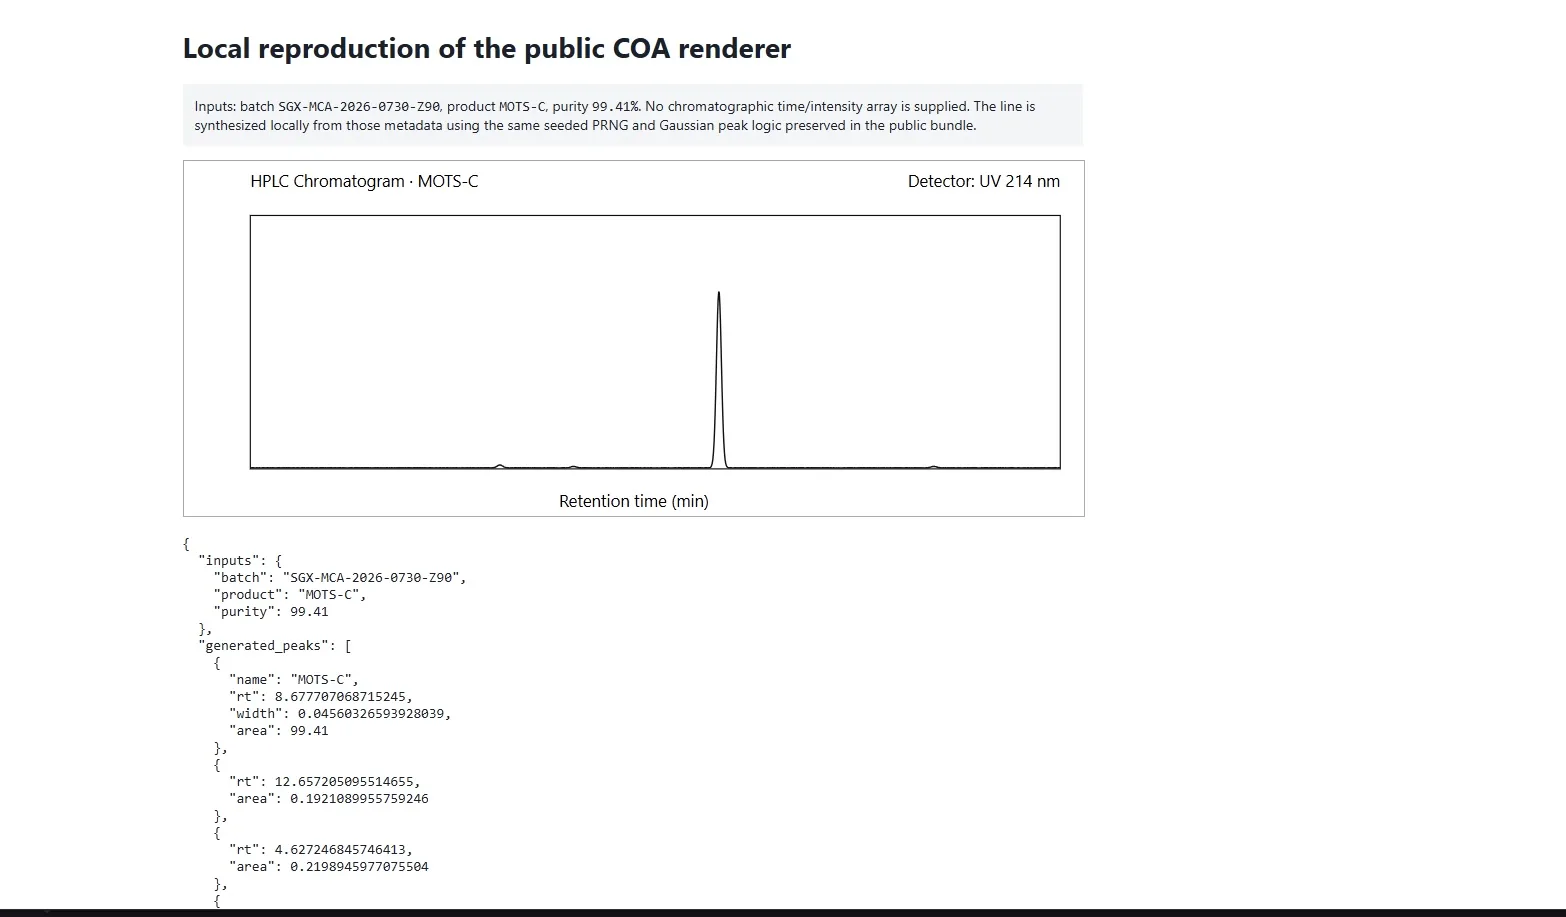
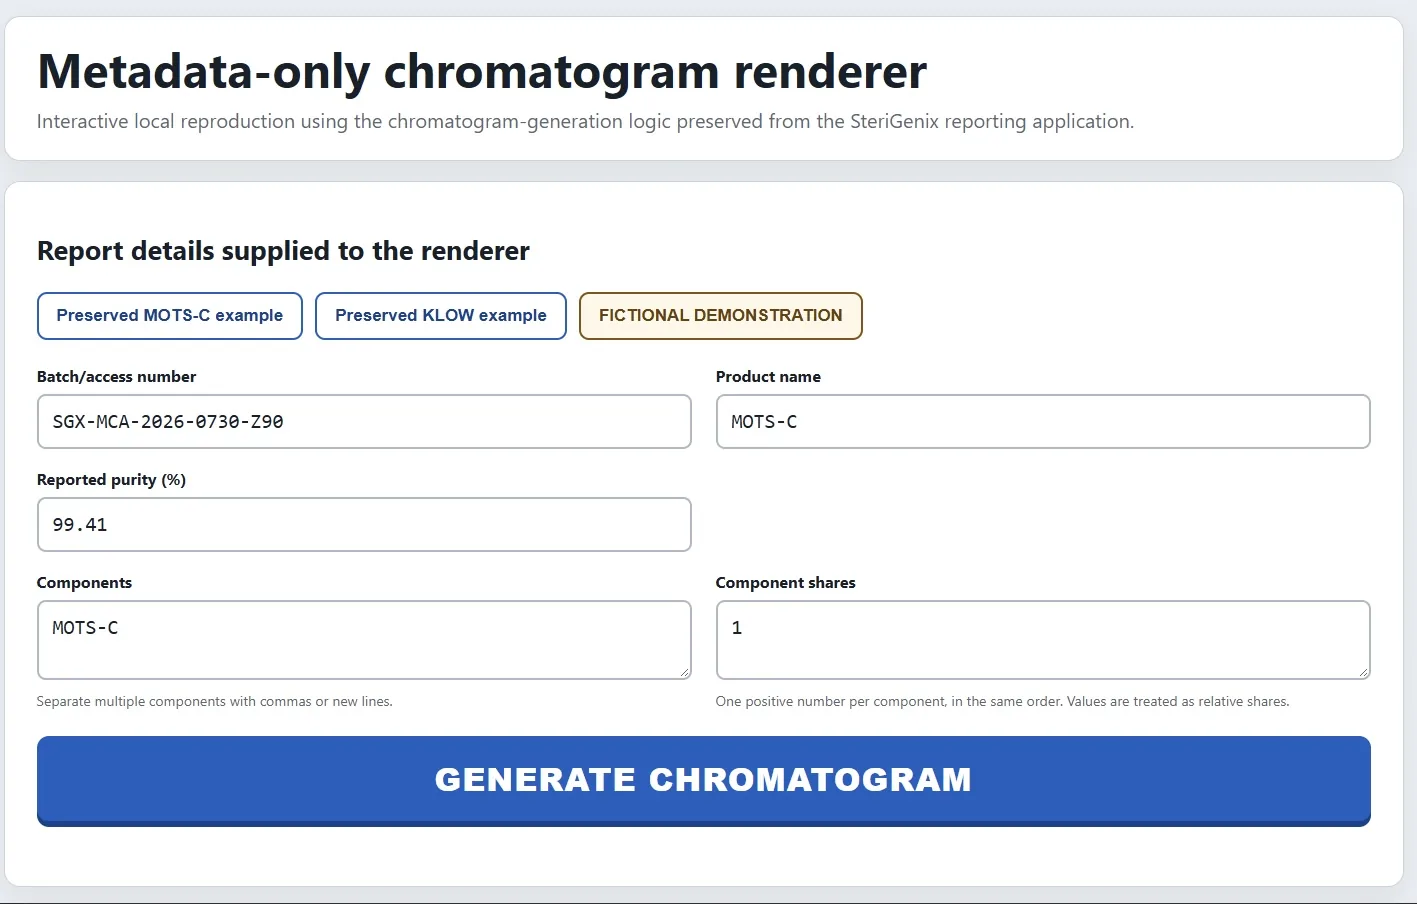
The renderer, the part of the website responsible for drawing the graph, accepted six pieces of information: the batch or access number; the product name; the reported purity; the component names; optional component amounts or shares and the test date.
From those details, the code created the chromatogram itself. It generated its own time points from zero to 15 minutes, decided where the main peaks would appear, added smaller peaks and baseline noise, and scaled the finished trace for display. The test date was used only in the text beneath the graph. The renderer did not accept measured retention-time data, detector-intensity data, a native instrument file, a peak table, an injection identifier or other acquisition data. A search of all 85 preserved JavaScript files also found no separate route by which genuine HPLC detector data could be fed into the public chromatogram component.
Put simply, the normal sequence would be:
sample tested → detector records data → chromatogram plotted → result calculated
The SteriGenix public reporting system instead allowed:
result/report information entered → website generates chromatogram
And the reported purity value was already one of the inputs used to create that graph.
Does that mean SteriGenix invented the results?
No. That’s where an important distinction has to be made. The renderer tells us how the graph was created, it doesn’t tell us where the purity number entered into the report originally came from.
There are at least two possible scenarios.
In one, SteriGenix genuinely tested the sample, obtained a real purity result, entered that result into its reporting system, and then allowed the website to generate an artificial chromatogram to accompany the genuine number.
In the other, a result could have been entered manually without genuine testing, and the same system could still generate a convincing-looking chromatogram around it.
The renderer evidence alone can’t tell us which happened and that is why this investigation does not claim that SteriGenix simply invented all its results. In fact, there is evidence that some of its numbers were accurate. Different vials from the same kits were tested by BT Labs and Verifi Labs, and several of those independent measurements were remarkably close to the figures reported by SteriGenix. That makes the distinction even more important.
Some numbers may have been correct while the chromatogram presented as supporting evidence was still generated by the website rather than produced from the detector data.
The real question is therefore not simply whether a particular purity number was right. It’s what analytical evidence actually sat behind that number, and why a laboratory COA showed customers a chromatogram that could be created without using the chromatographic measurements from the test.
Across all 3,003 reports
The audit covered the complete reconstructed inventory of 3,003 SteriGenix public reports. Of those, 3,000 were set up to display a generated chromatogram. Three contained an internal instruction telling the website not to show one. Of those, two were bacteriostatic-water reports, while the third was a failed RA10 sample in which SteriGenix reported no identifiable peptide. None explained to the customer why the graph had been omitted.
Twenty historical SteriGenix chromatograms had already been preserved, and all 20 were exact matches to the graphs recreated from the website code. I then checked all 3,003 live verification pages in October 2026. Every page still worked. Of the 3,000 reports showing a chromatogram, every graph matched the preserved renderer exactly. The other three still showed no chromatogram, matching the internal settings found in their archived report data.
The historical captures prove the renderer was being used on those 20 reports at the time. When I checked the site again in October, the same graph-generating system was still in use across the live reports.
It was not the only reporting-system issue
The preserved code revealed other shortcuts in the reporting system too. If the appearance field was left blank, the software could automatically fill it with “White Powder.” A populated result could receive a reassuring check mark unless its status was explicitly set to FAIL.
More strikingly, if an HPLC purity result was left blank, the code could generate a value between 99.00% and 99.99% and mark it as PASS. A separate part of the public renderer also used 99 as a fallback when it couldn’t find a purity value to feed into the chromatogram generator.
https://flourishing-concha-08c42c.netlify.app/reporting-behaviour.html
The system also allowed existing reports to be copied into new drafts and reused as templates. That feature alone isn’t unusual for reporting software and doesn’t prove reports were improperly duplicated.
But taken together, these functions show that some of what appeared on a COA could be supplied automatically by the reporting system rather than entered from a fresh observation or measurement of that particular sample.
That becomes more important when considered alongside what happened when one high-volume customer began asking SteriGenix for the underlying analytical records.
The customer who kept asking questions
A customer who used SteriGenix heavily provided 64 COAs, covering a wide range of peptides and other products between July and early September 2026. By then, they were already asking questions about how the lab was working. Repeated endotoxin results and SteriGenix’s claims around LC-MS identification prompted them to ask for the evidence behind the COAs rather than relying on the reports alone. They requested raw HPLC files, integration data, mass spectra, endotoxin worksheets and method details. At first, SteriGenix’s response was reassuring: it said those records existed and could be provided.
What did “<0.5 EU/mL” actually mean?
The customer had noticed repeated endotoxin results of <0.5 EU/mL across many samples. In a detailed response, SteriGenix explained that the number was not an individual measured endotoxin concentration. It said <0.5 EU/mL was the reporting limit at the dilution used for a kinetic chromogenic LAL assay. In other words, samples falling below that threshold were reported identically because no detectable endotoxin was being reported at that tested dilution.
That is a legitimate distinction.
A result such as <0.5 EU/mL means the level was below the lab’s reporting limit, not that the sample measured exactly 0.5. SteriGenix also acknowledged that the reporting limit might be too coarse for the customer’s purposes and said a lower dilution factor could distinguish values rather than collapsing them all under one threshold.
More importantly, it offered to provide the supporting evidence. The response said HPLC raw-data files and integration reports could be supplied, along with MS spectra, endotoxin worksheets containing standard-curve information, r-values, spike recovery and dilution factors, equipment make/model details and calibration and qualification records. It also said raw data were retained for three years. That’s consistent with SteriGenix’s current public Privacy Policy, which continues to state that raw instrument data and laboratory records are retained for three years from the test date. SteriGenix went further: it offered to assemble a complete raw-data package covering roughly 35 samples submitted by the customer. If those native records exist, they could answer many of the questions in this article.
Asking for the native files
On 7 August, SteriGenix sent the customer a prepared analytical packet containing supporting material. A week later, the customer asked for something more important: the original files produced by the laboratory equipment itself, rather than summaries or screenshots. SteriGenix asked whether the customer had the specialist software needed to open those files. Shortly afterwards, however, it sent another prepared PDF relating to the RT30 sample.
The material reviewed here doesn’t include the original instrument files needed to independently reconstruct the testing. What survives are mainly prepared PDFs and supporting packets.
According to the customer, the material SteriGenix supplied as supporting data appeared synthetic rather than genuine instrument output. However, the native instrument files themselves weren’t included in the evidence provided for this investigation
Then SteriGenix acknowledged that part of the supporting packet was wrong
The most concrete problem in the supporting documentation arose from TR20 and TR40. The customer had submitted one physical vial of each strength but the analytical packet apparently described V1, V2 and V3 as though three separate vials had each been individually weighed, emptied and reweighed. The customer challenged SteriGenix and their response was explicit. SteriGenix said the correct procedure had involved the single submitted vial being reconstituted and split into replicate preparations, with each preparation injected in duplicate. The language describing V1, V2 and V3 as separate weighed vials, SteriGenix said, had come from a multi-vial gravimetric template and should not have been used for a single-vial submission. The customer had also noticed that the same three empty-vial weights appeared in both the TR20 and TR40 packets.
Below is Sterigenix’s written response acknowledging that the TR20/TR40 packets incorrectly described a single-vial submission as three separately weighed vials, and that the repeated empty-vial weights were template reference values rather than sample measurements.
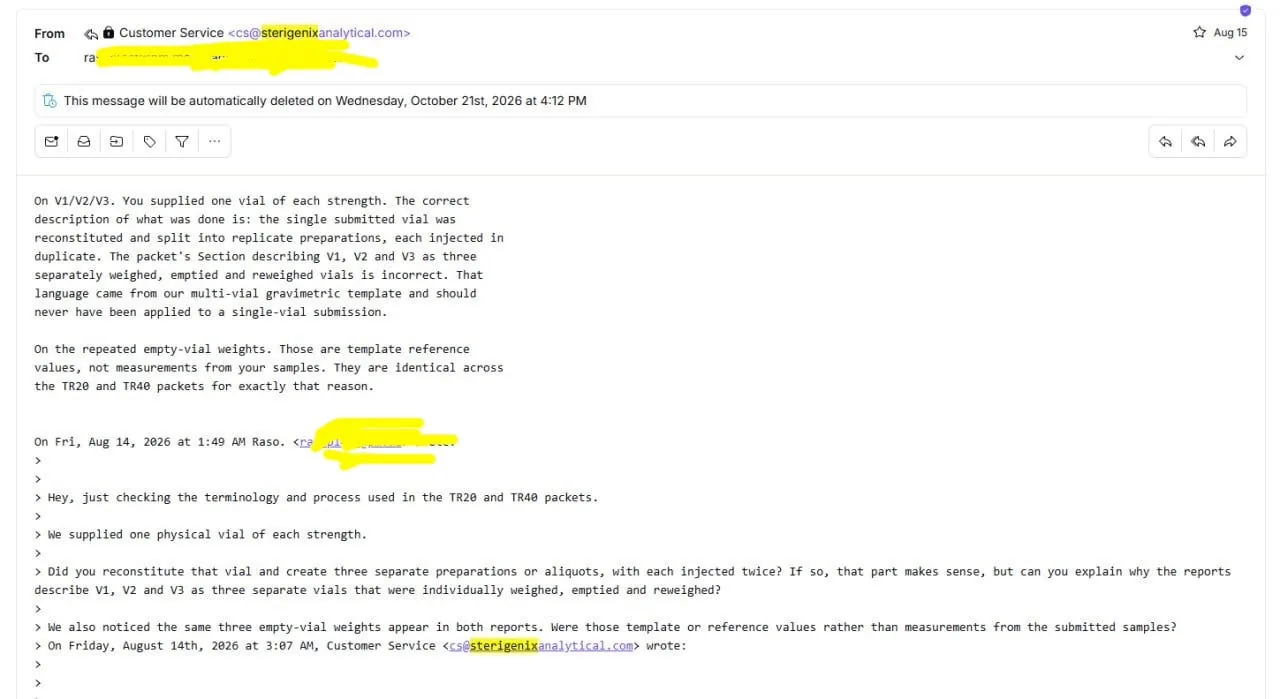
SteriGenix’s explanation was that those were template reference values, not measurements taken from the submitted samples. That’s a significant admission. It doesn’t prove the HPLC injections themselves were invented, but it does establish that documentation supplied as supporting analytical material contained procedural descriptions and numerical vial-weight information that did not describe the submitted samples as presented.
Taken alongside the metadata-generated chromatograms, it raises a broader question: how much of the analytical-looking material on SteriGenix reports and supporting packets represented direct sample-specific measurements, and how much was generated or populated by a reporting template?
What happened when the same kits were tested elsewhere
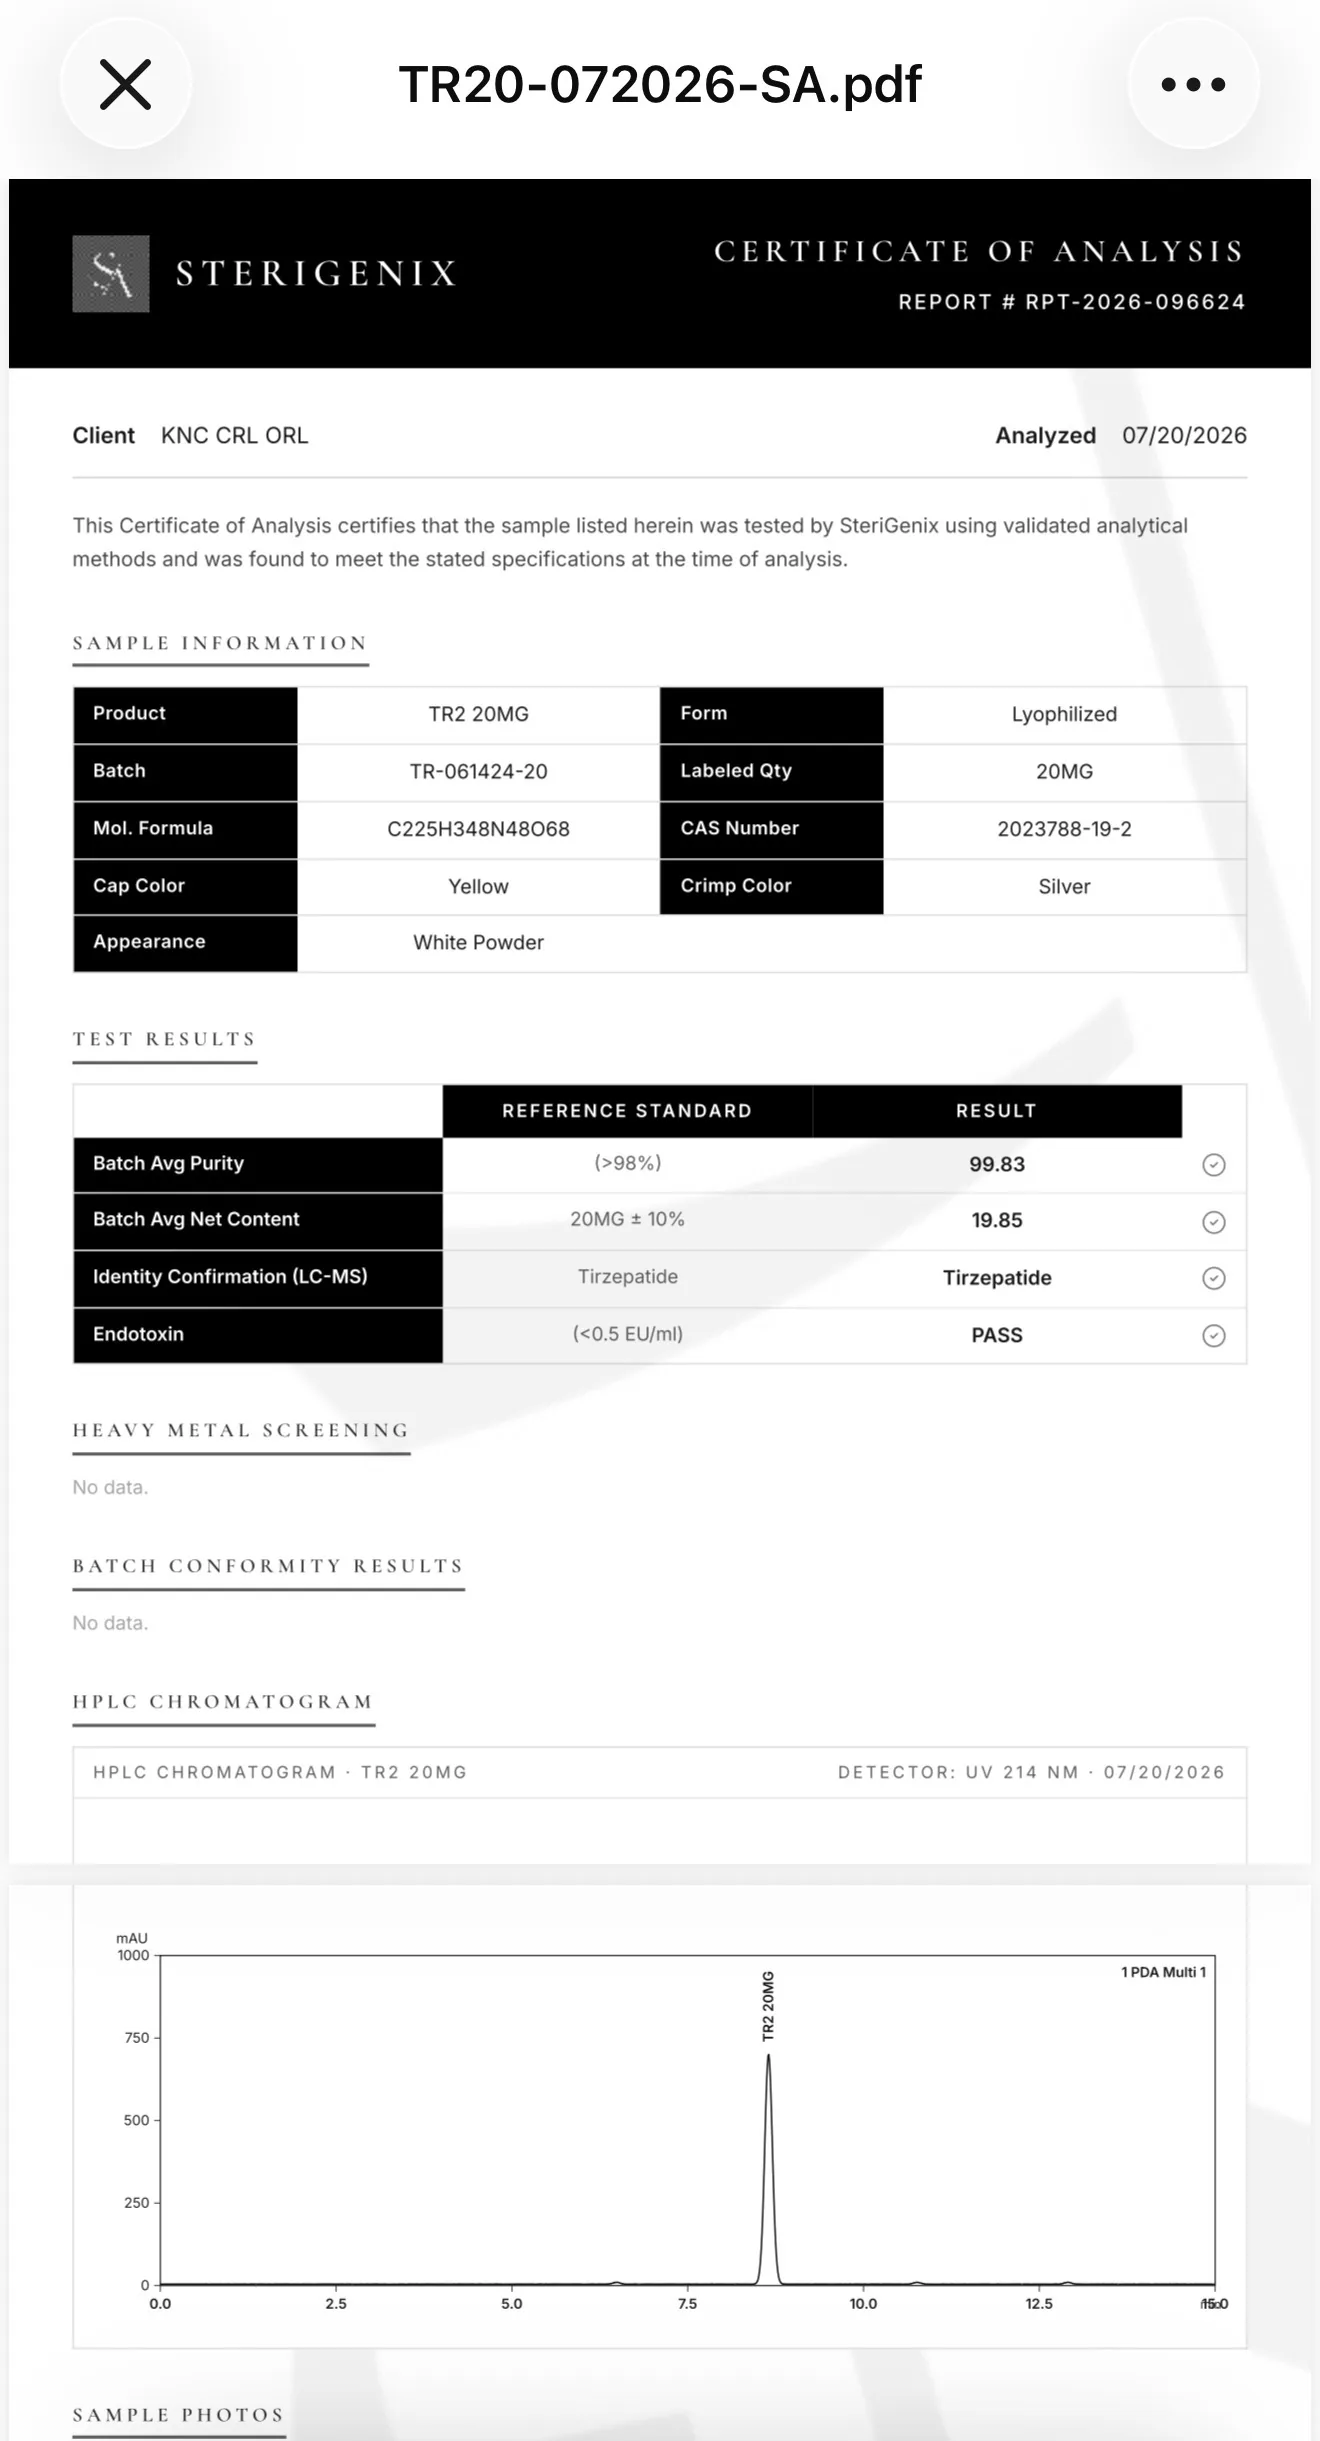
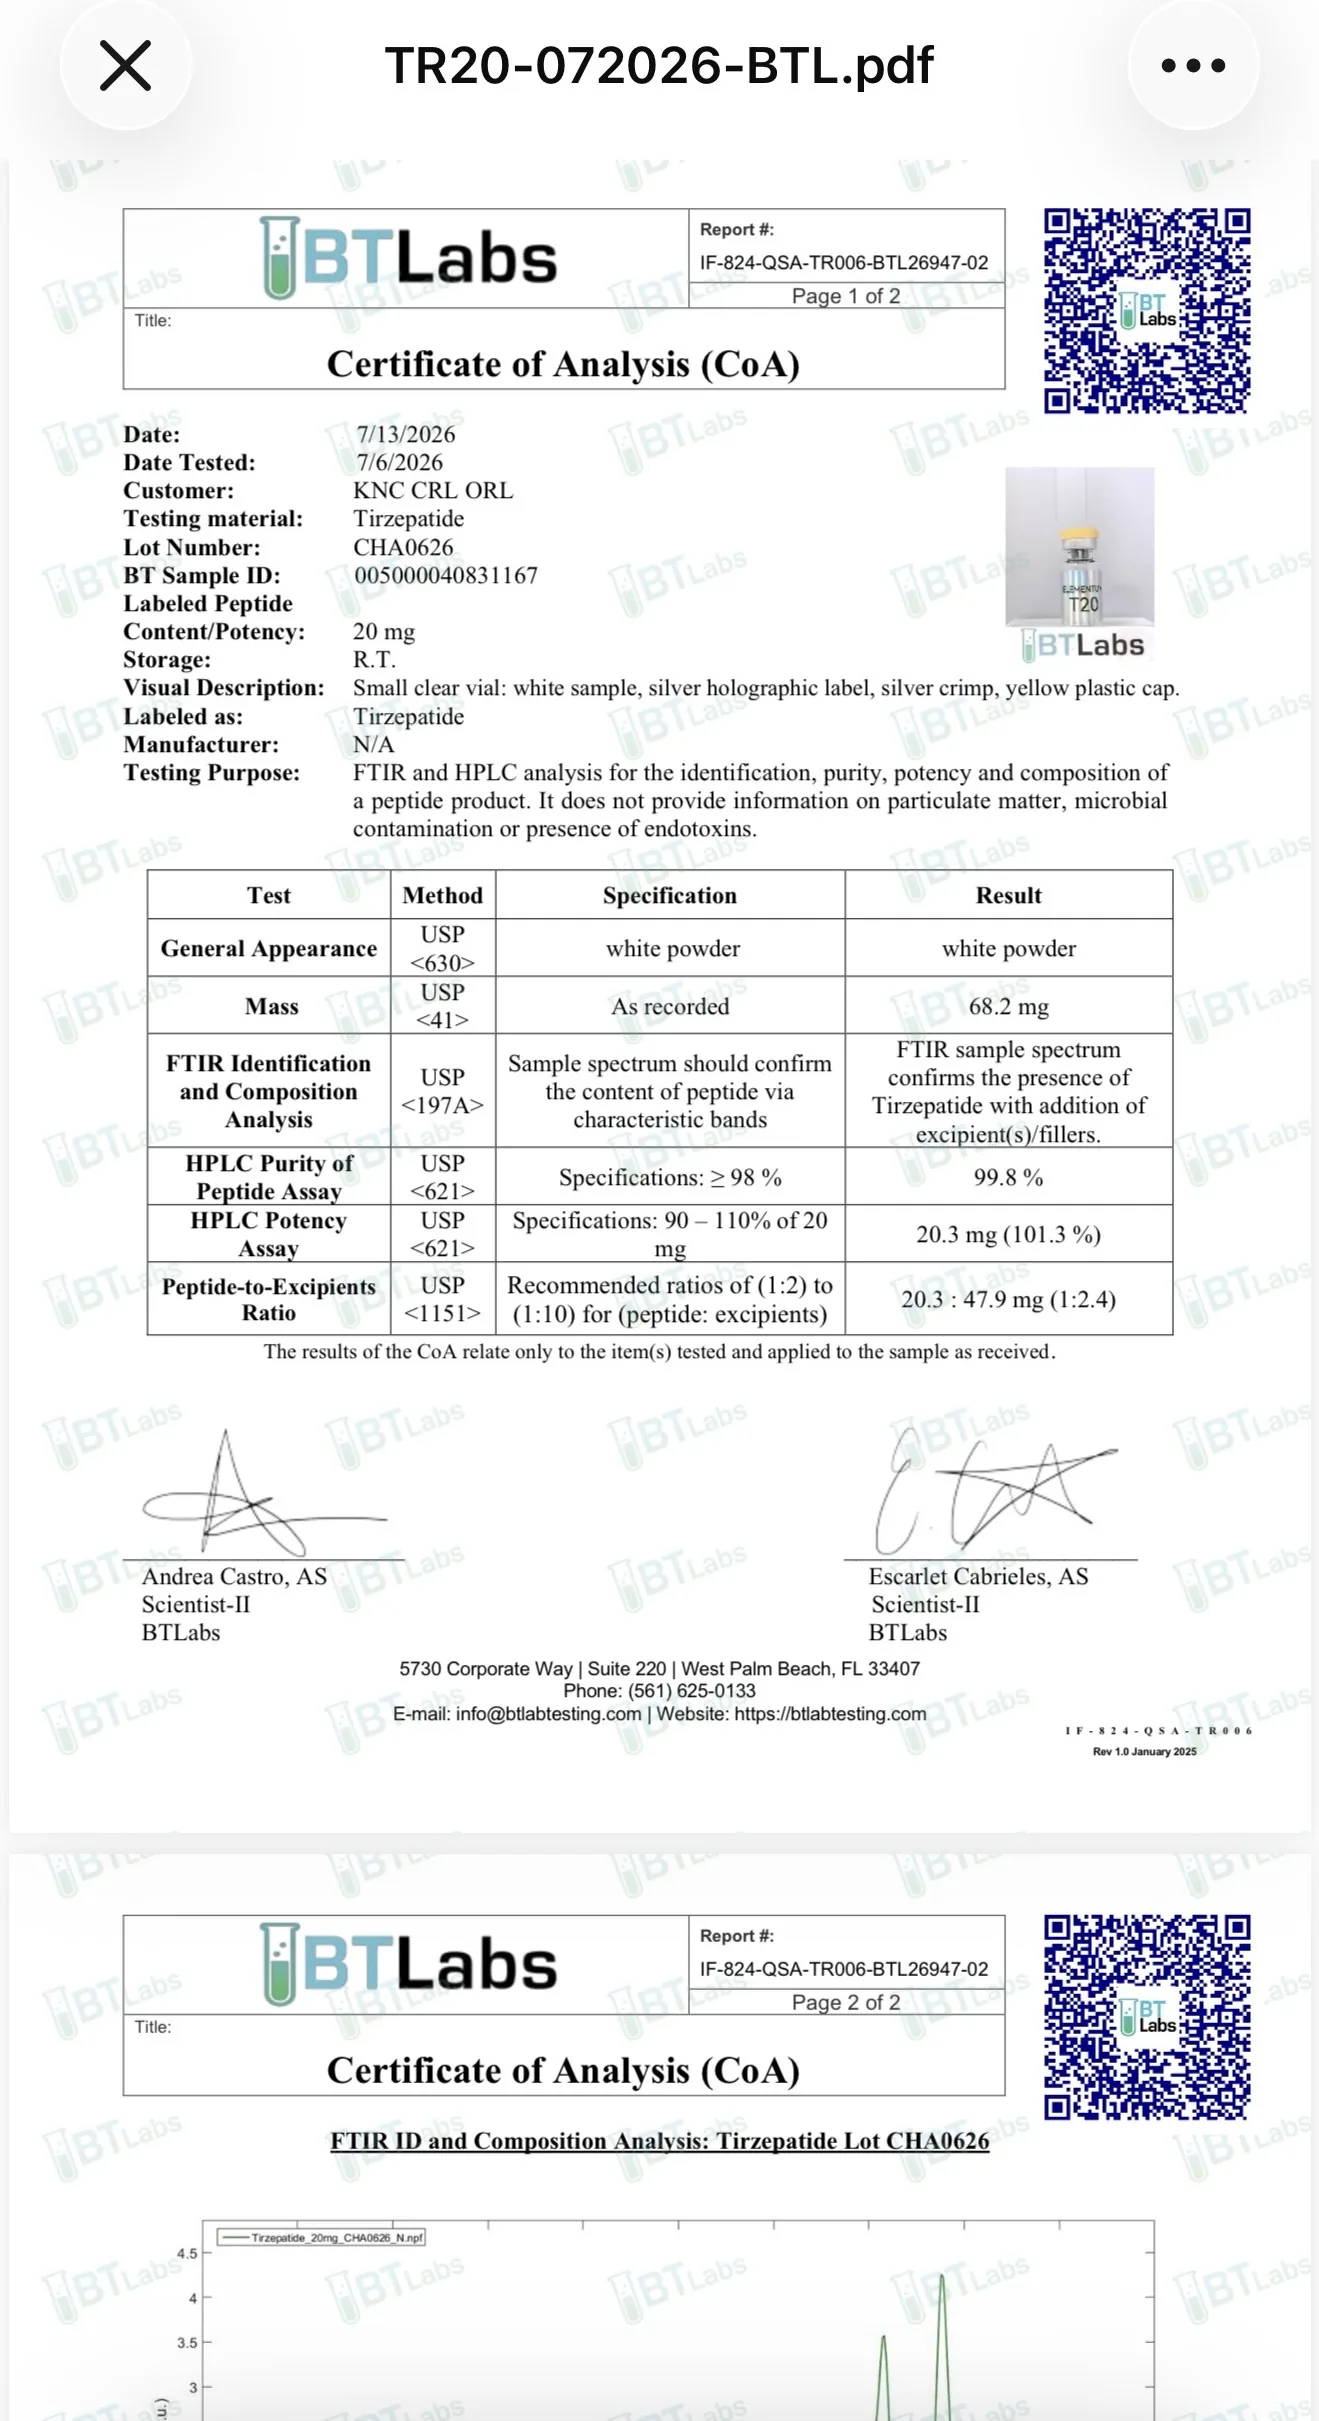
One obvious question is whether any SteriGenix results were ever checked by another laboratory. They were. The source said different vials from the same kits were sent to SteriGenix and independent labs on five occasions. Three of those comparison pairs have now been recovered and documented, and the results were strikingly close (see below)
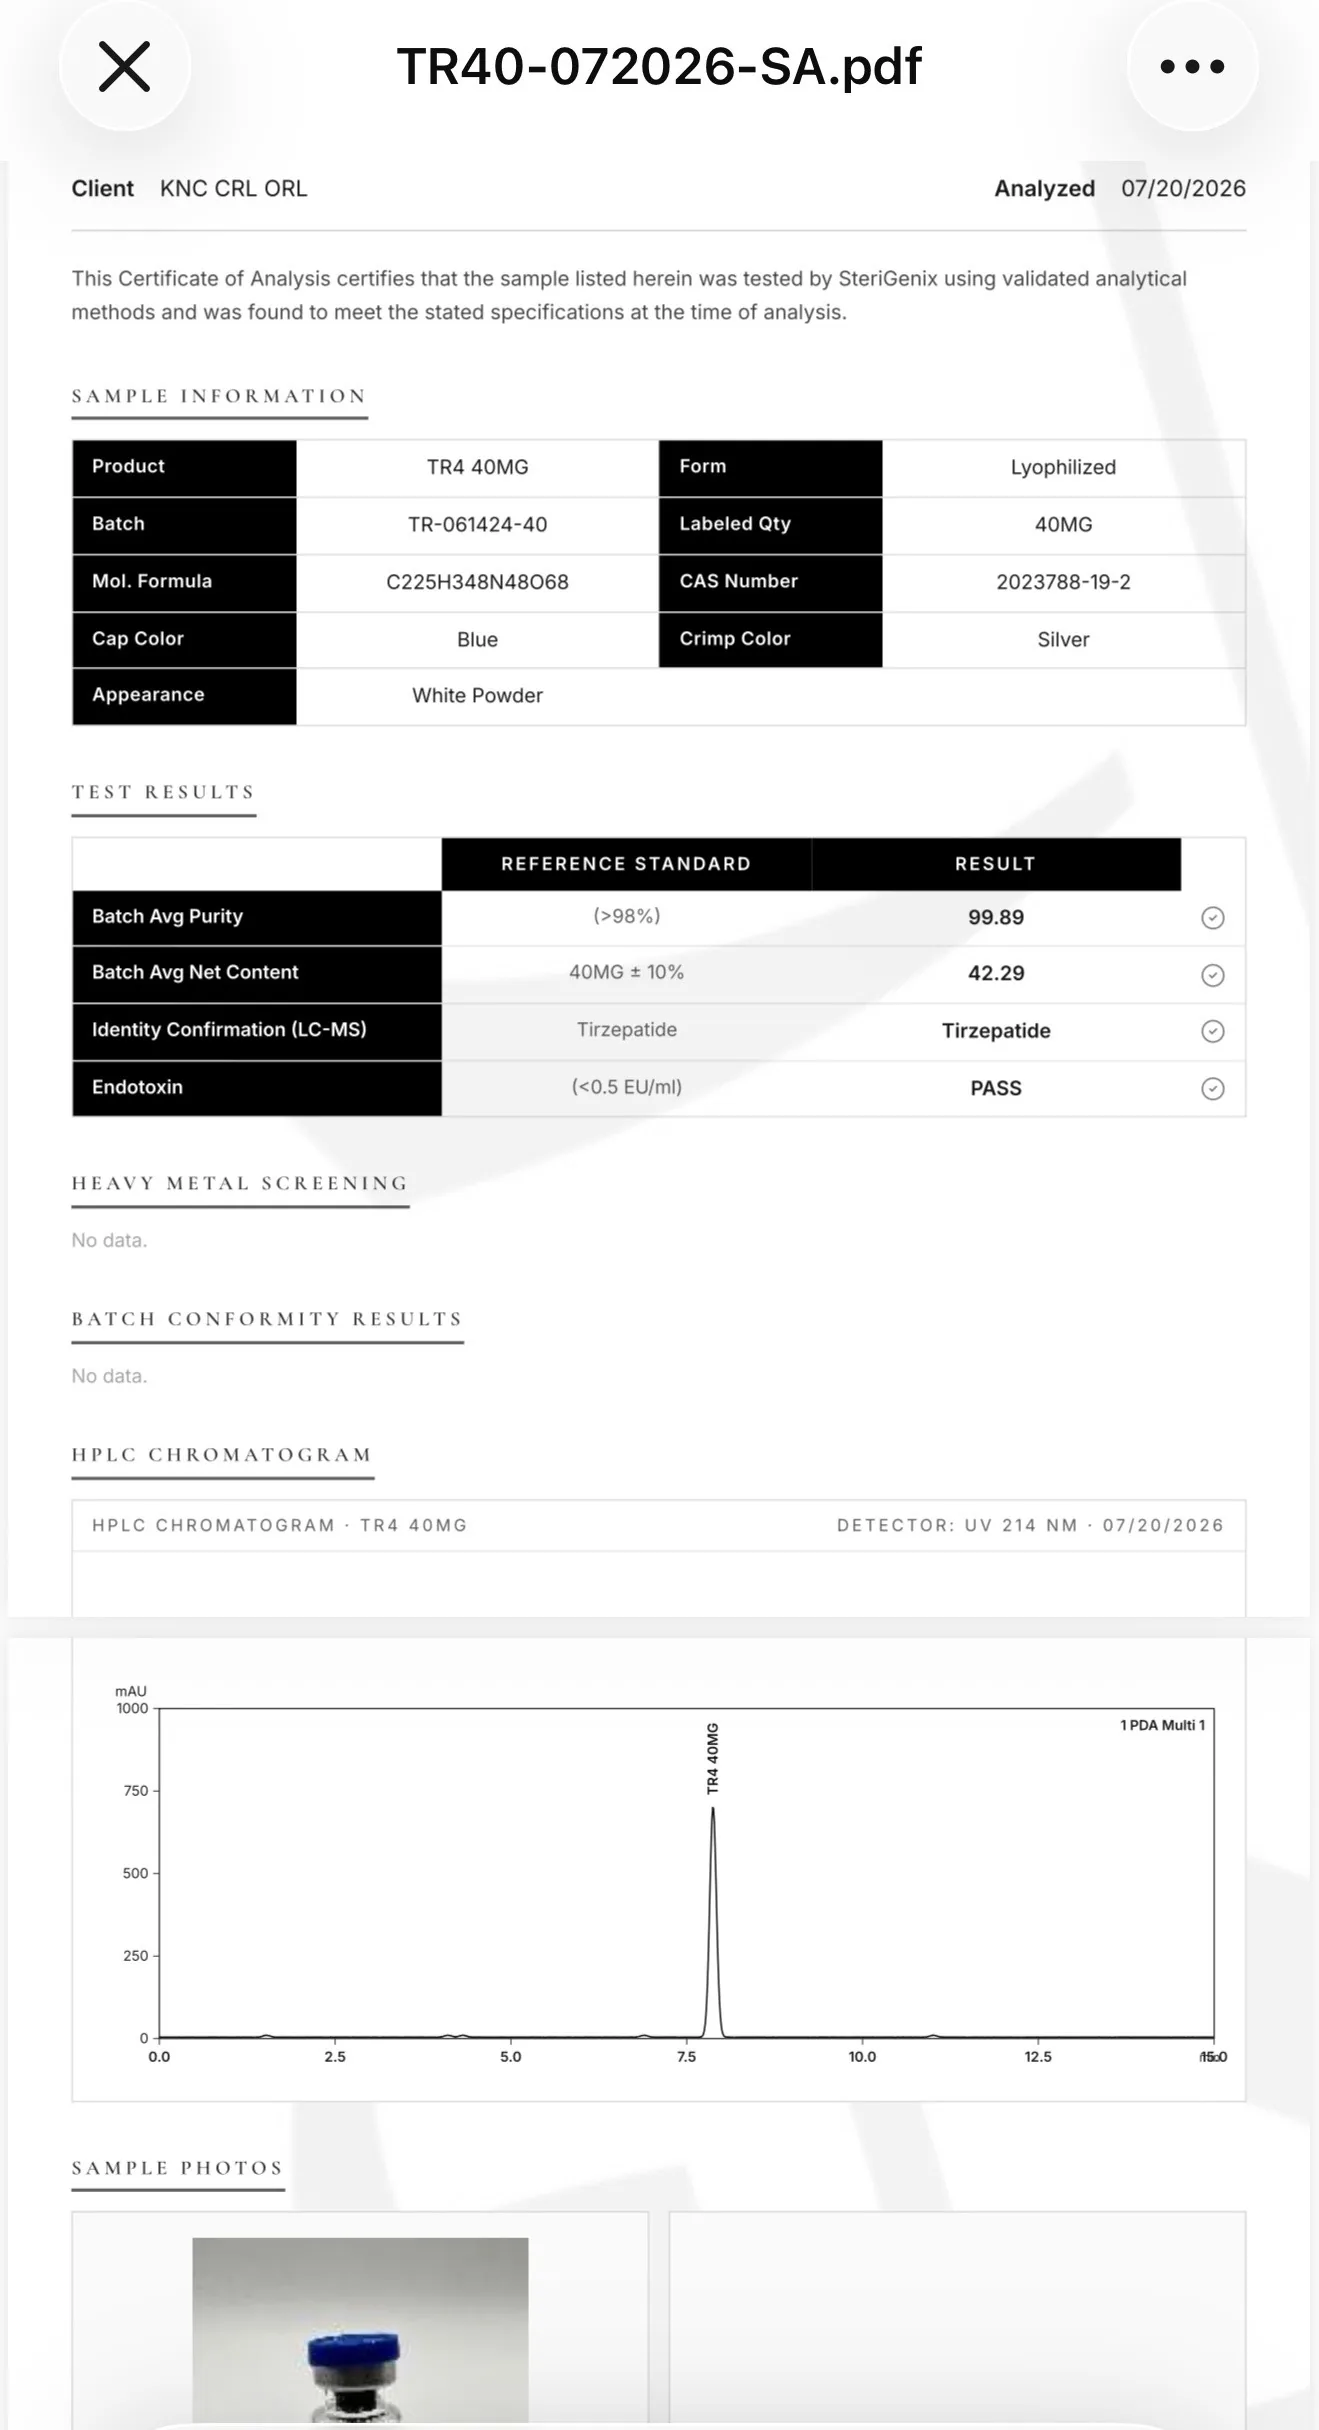
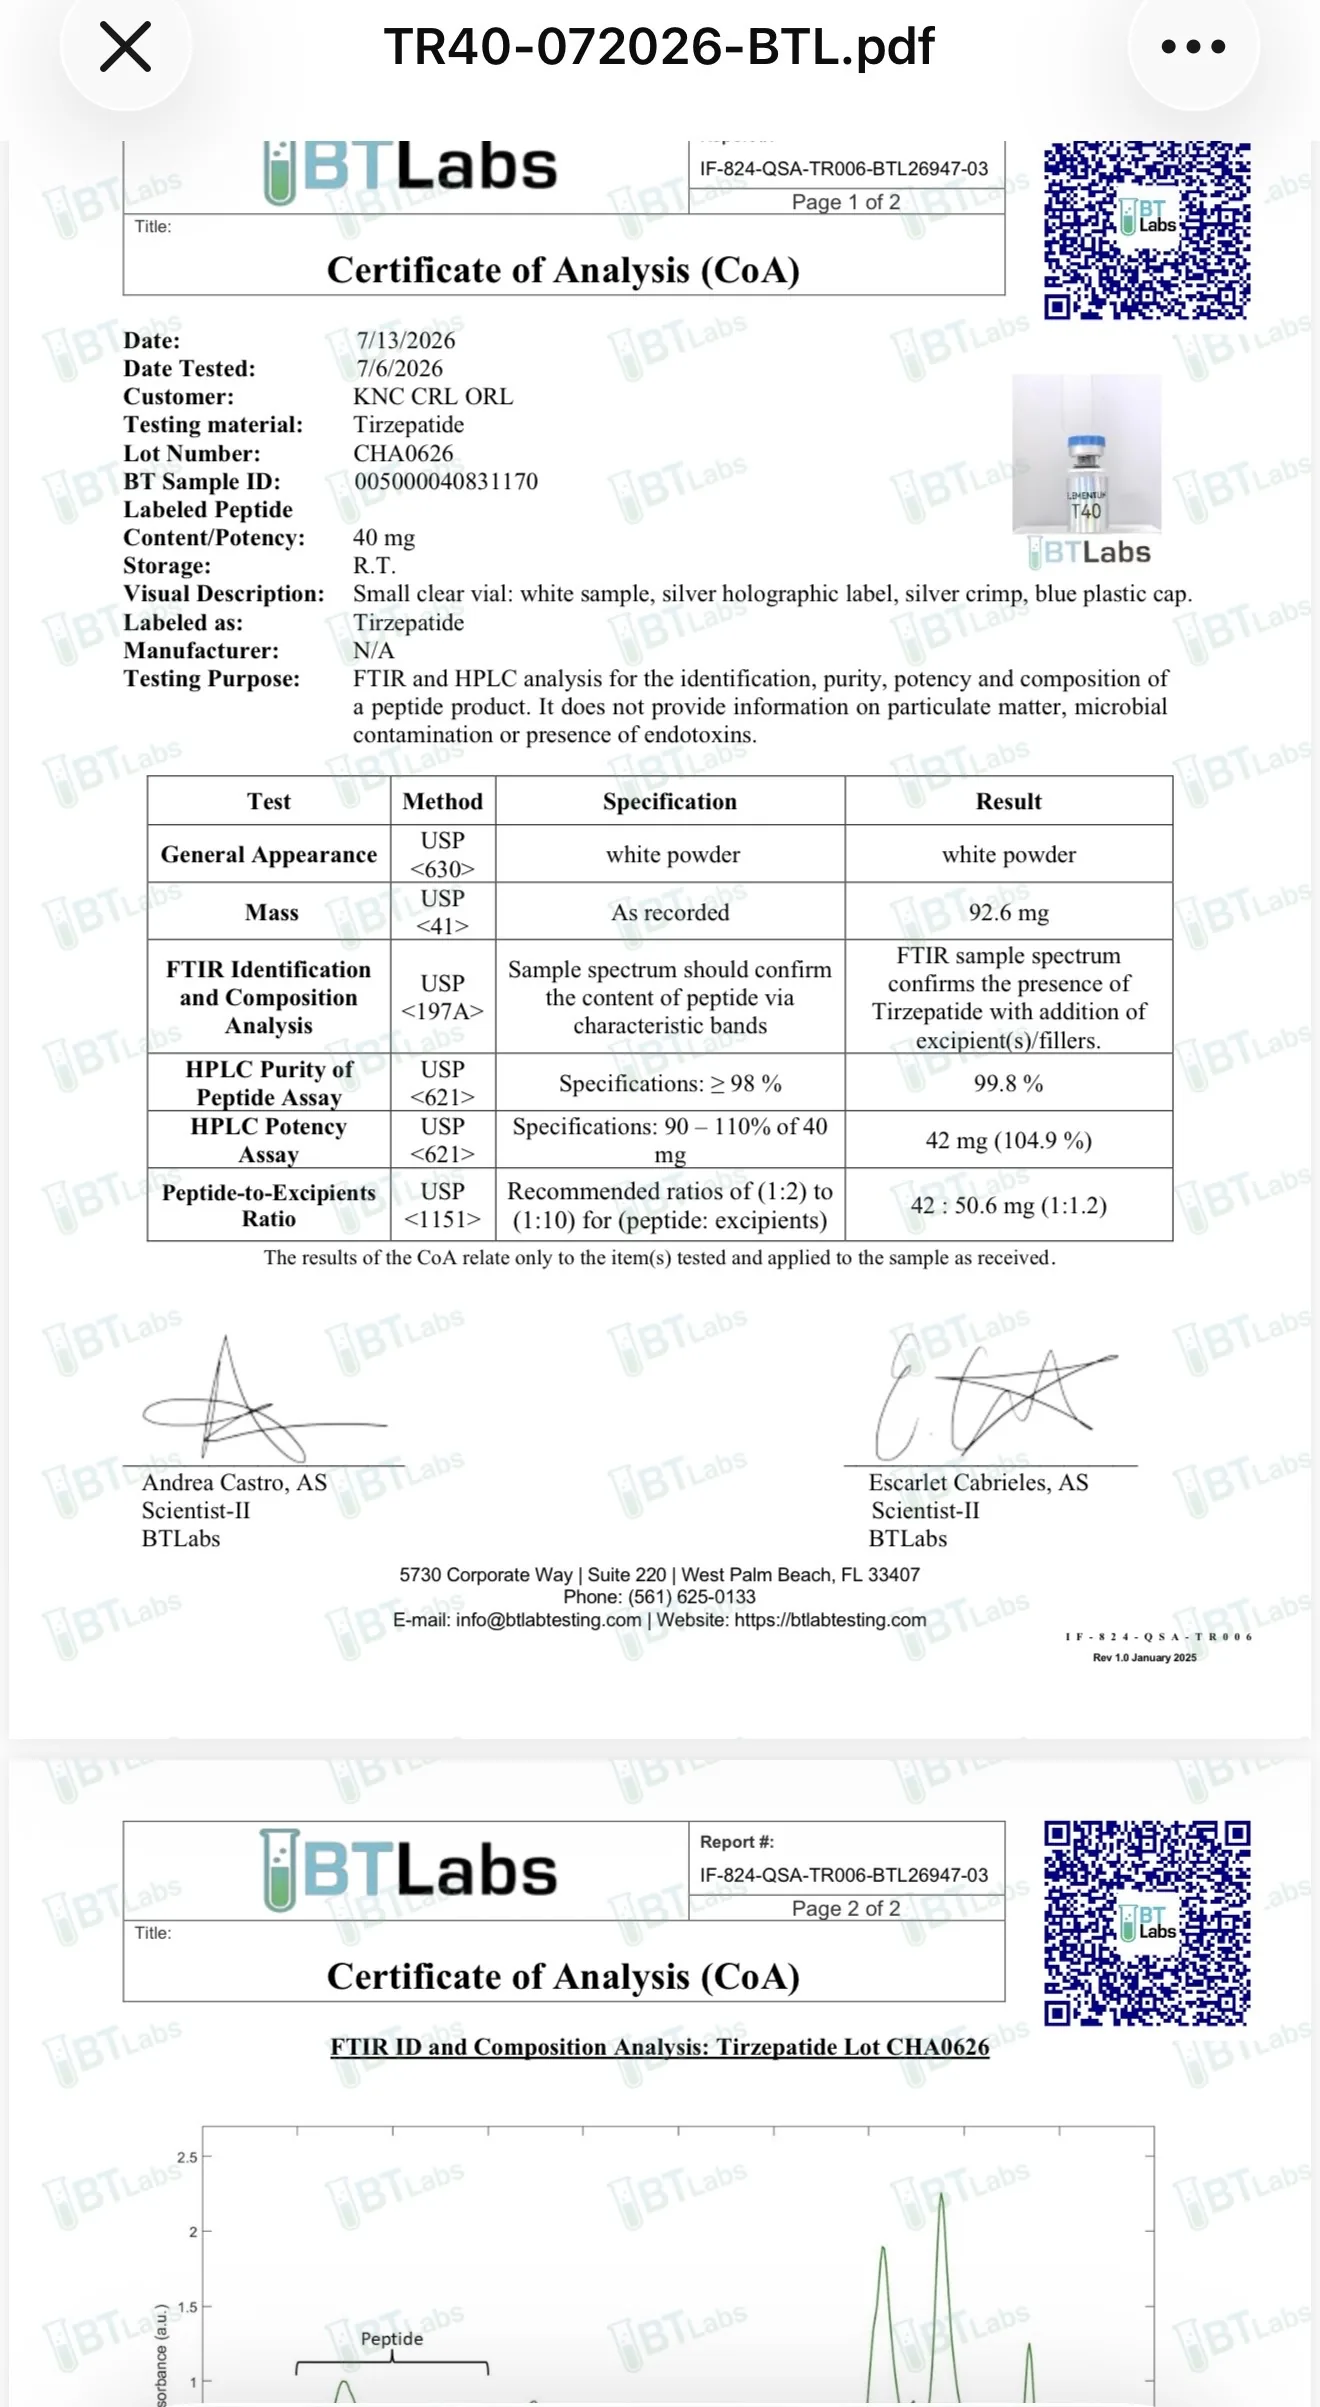
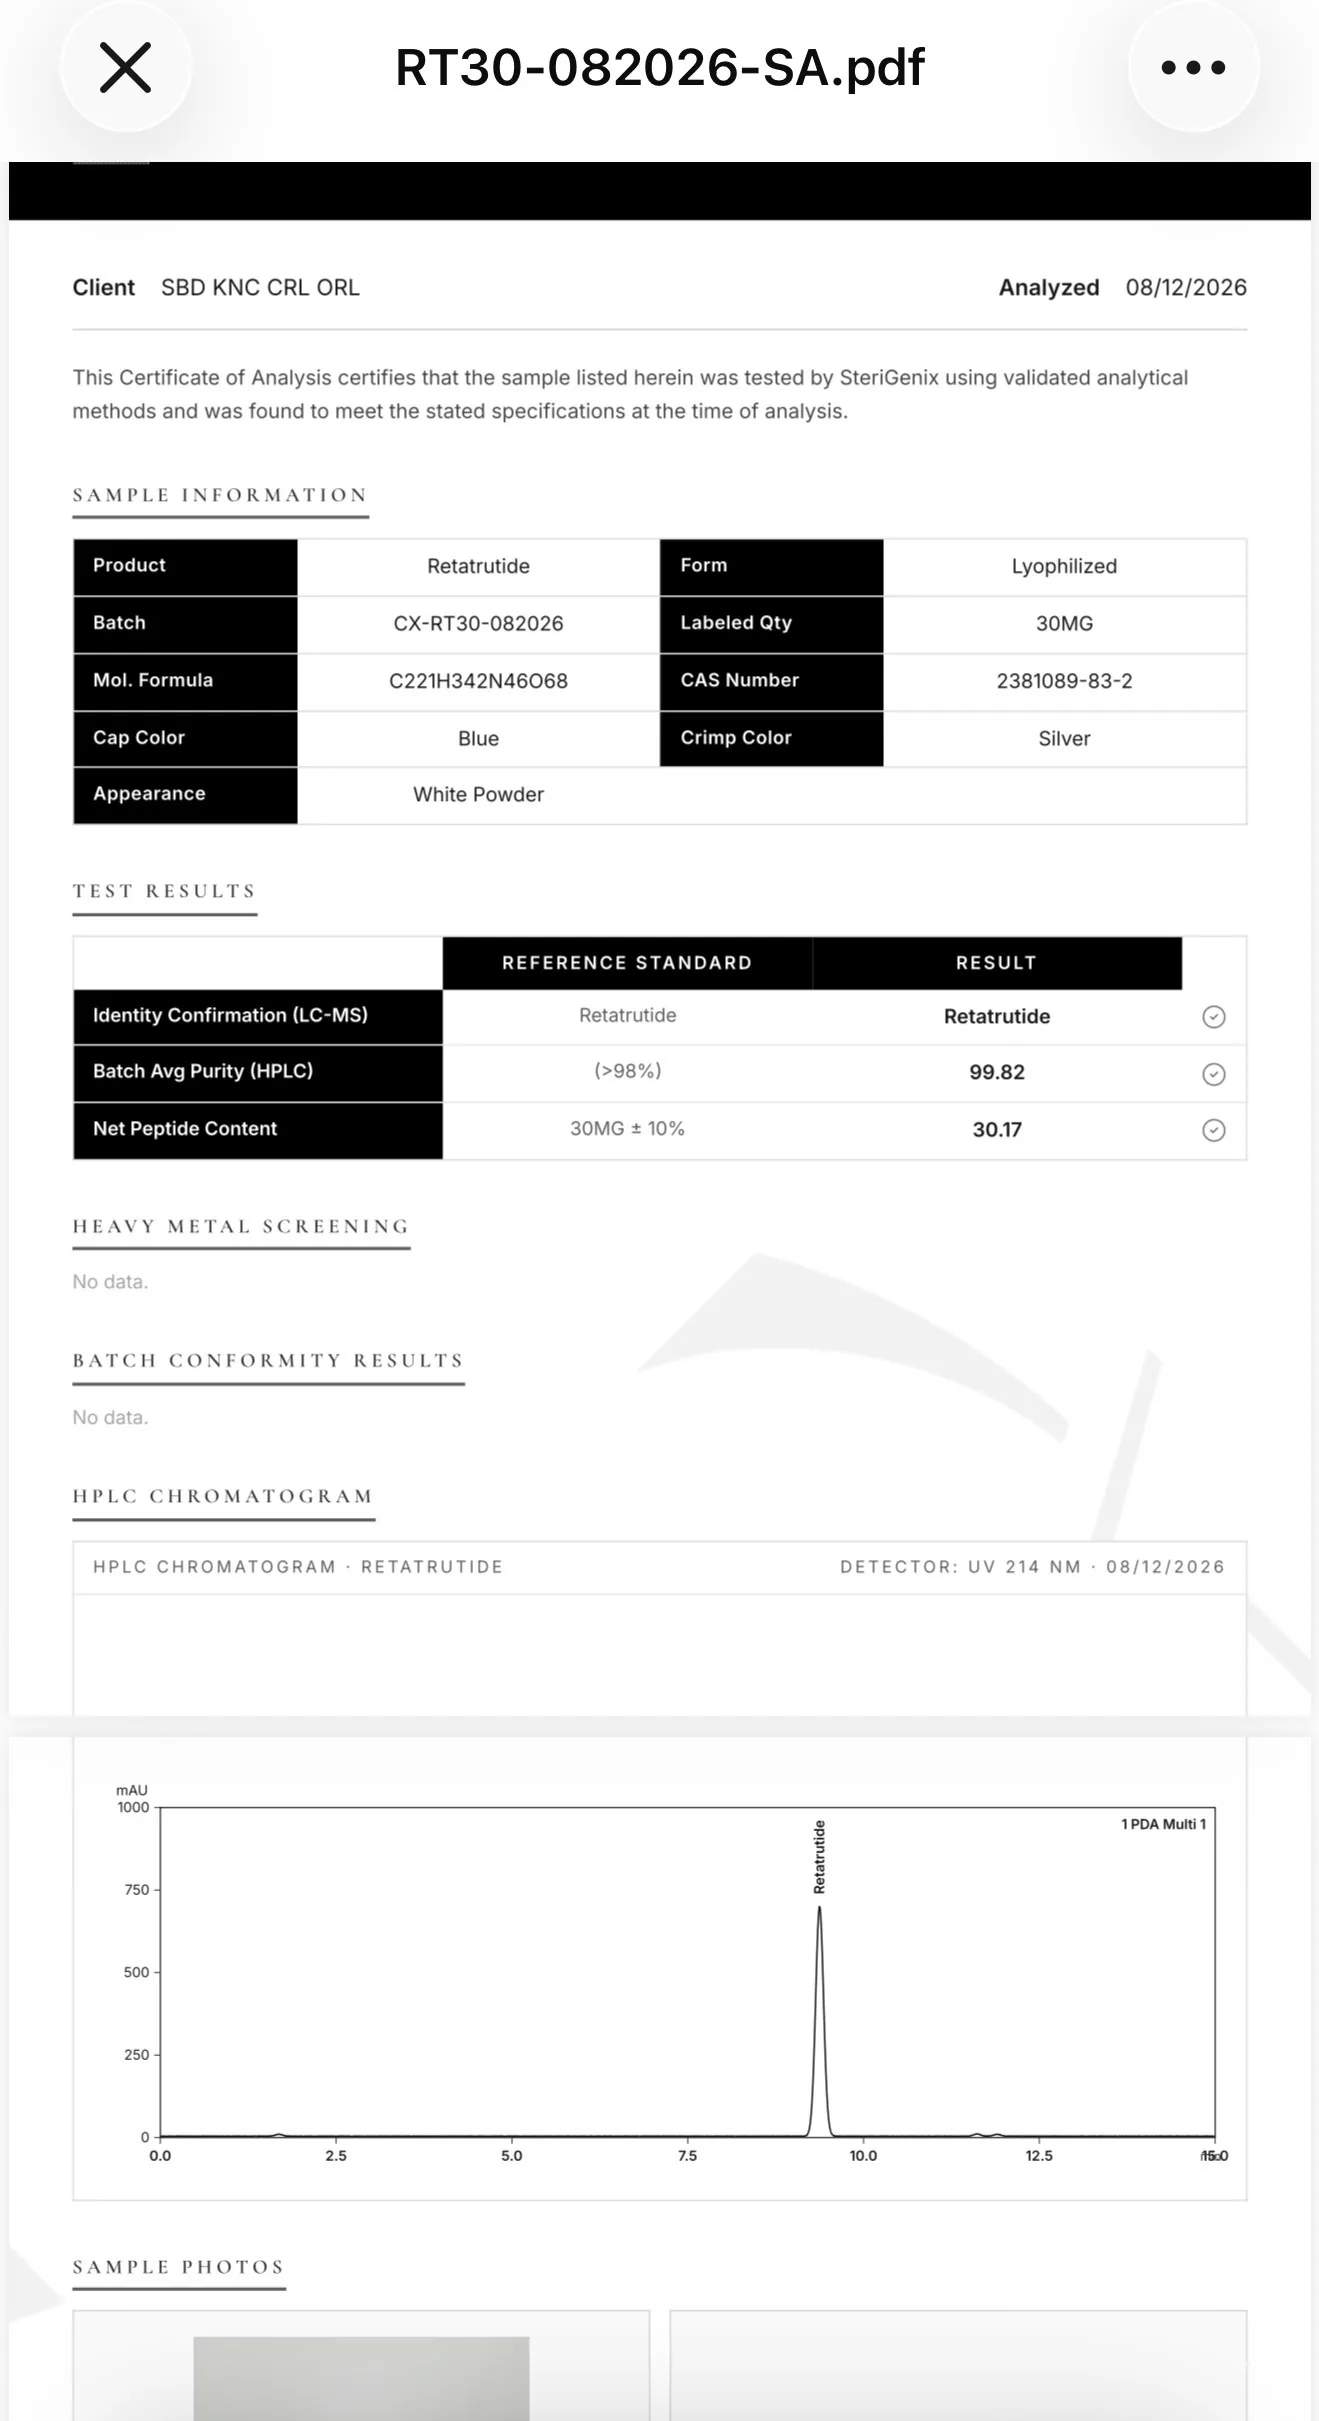
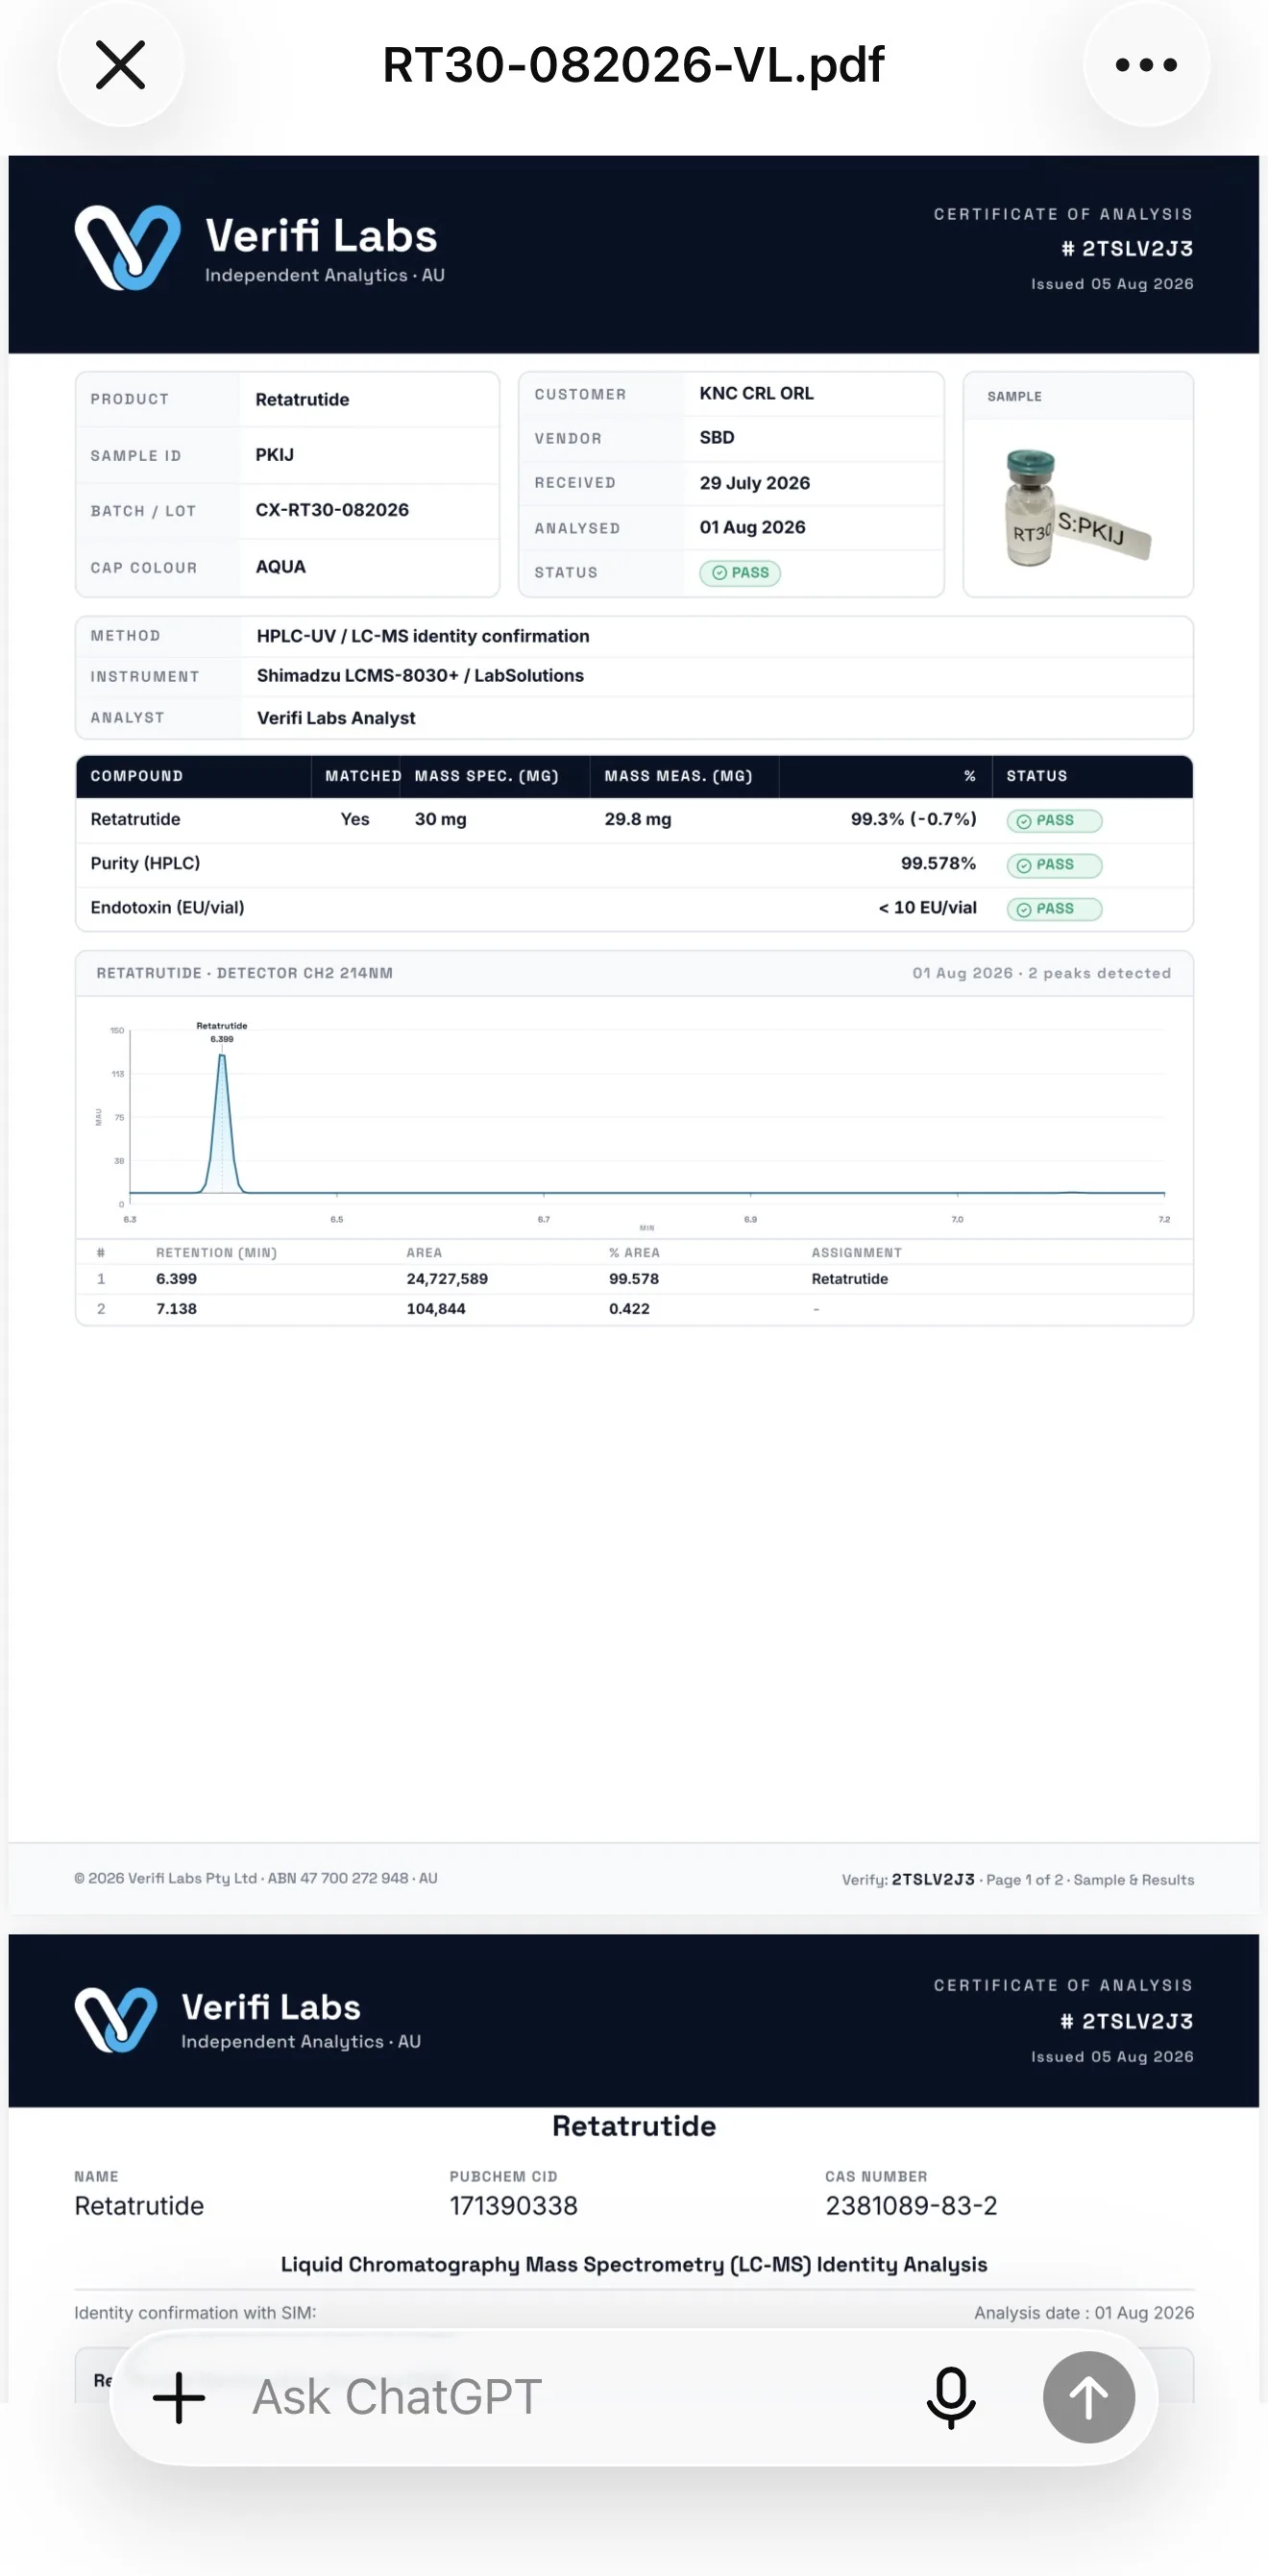
TR40, 40 mg tirzepatide
SteriGenix reported 99.89% purity and 42.29 mg. BT Labs tested another vial from the same kit and reported 99.8% purity and 42.0 mg.
Difference: 0.09 percentage points in purity and 0.29 mg in measured content.
TR20, 20 mg tirzepatide
SteriGenix reported 99.83% purity and 19.85 mg. BT Labs reported 99.8% purity and 20.3 mg from another vial from the same kit.
Difference: 0.03 percentage points in purity and 0.45 mg in measured content.
RT30, 30 mg retatrutide
SteriGenix reported 99.82% purity and 30.17 mg. Verifi Labs reported 99.578% purity and 29.8 mg, along with matching LC-MS identity.
Difference: 0.242 percentage points in purity and 0.37 mg in measured content.
Those are genuinely close results. On these three same-kit comparisons, SteriGenix’s reported purity and quantity were broadly consistent with independent laboratory testing.
The BT comparisons don’t independently confirm SteriGenix’s LC-MS identity or endotoxin testing, because BT used different methods and didn’t test endotoxin. Verifi did use LC-MS on the RT30 sample and also reported matching identity. So there’s good evidence here that at least some SteriGenix numerical results were accurate. That doesn’t resolve the separate issue with the public chromatograms, which were generated from the report information rather than the detector data.
SteriGenix vs Kovera Labs
The close BT Labs and Verifi comparisons weren’t the whole picture. One of the clearest disagreements involved retatrutide identity.
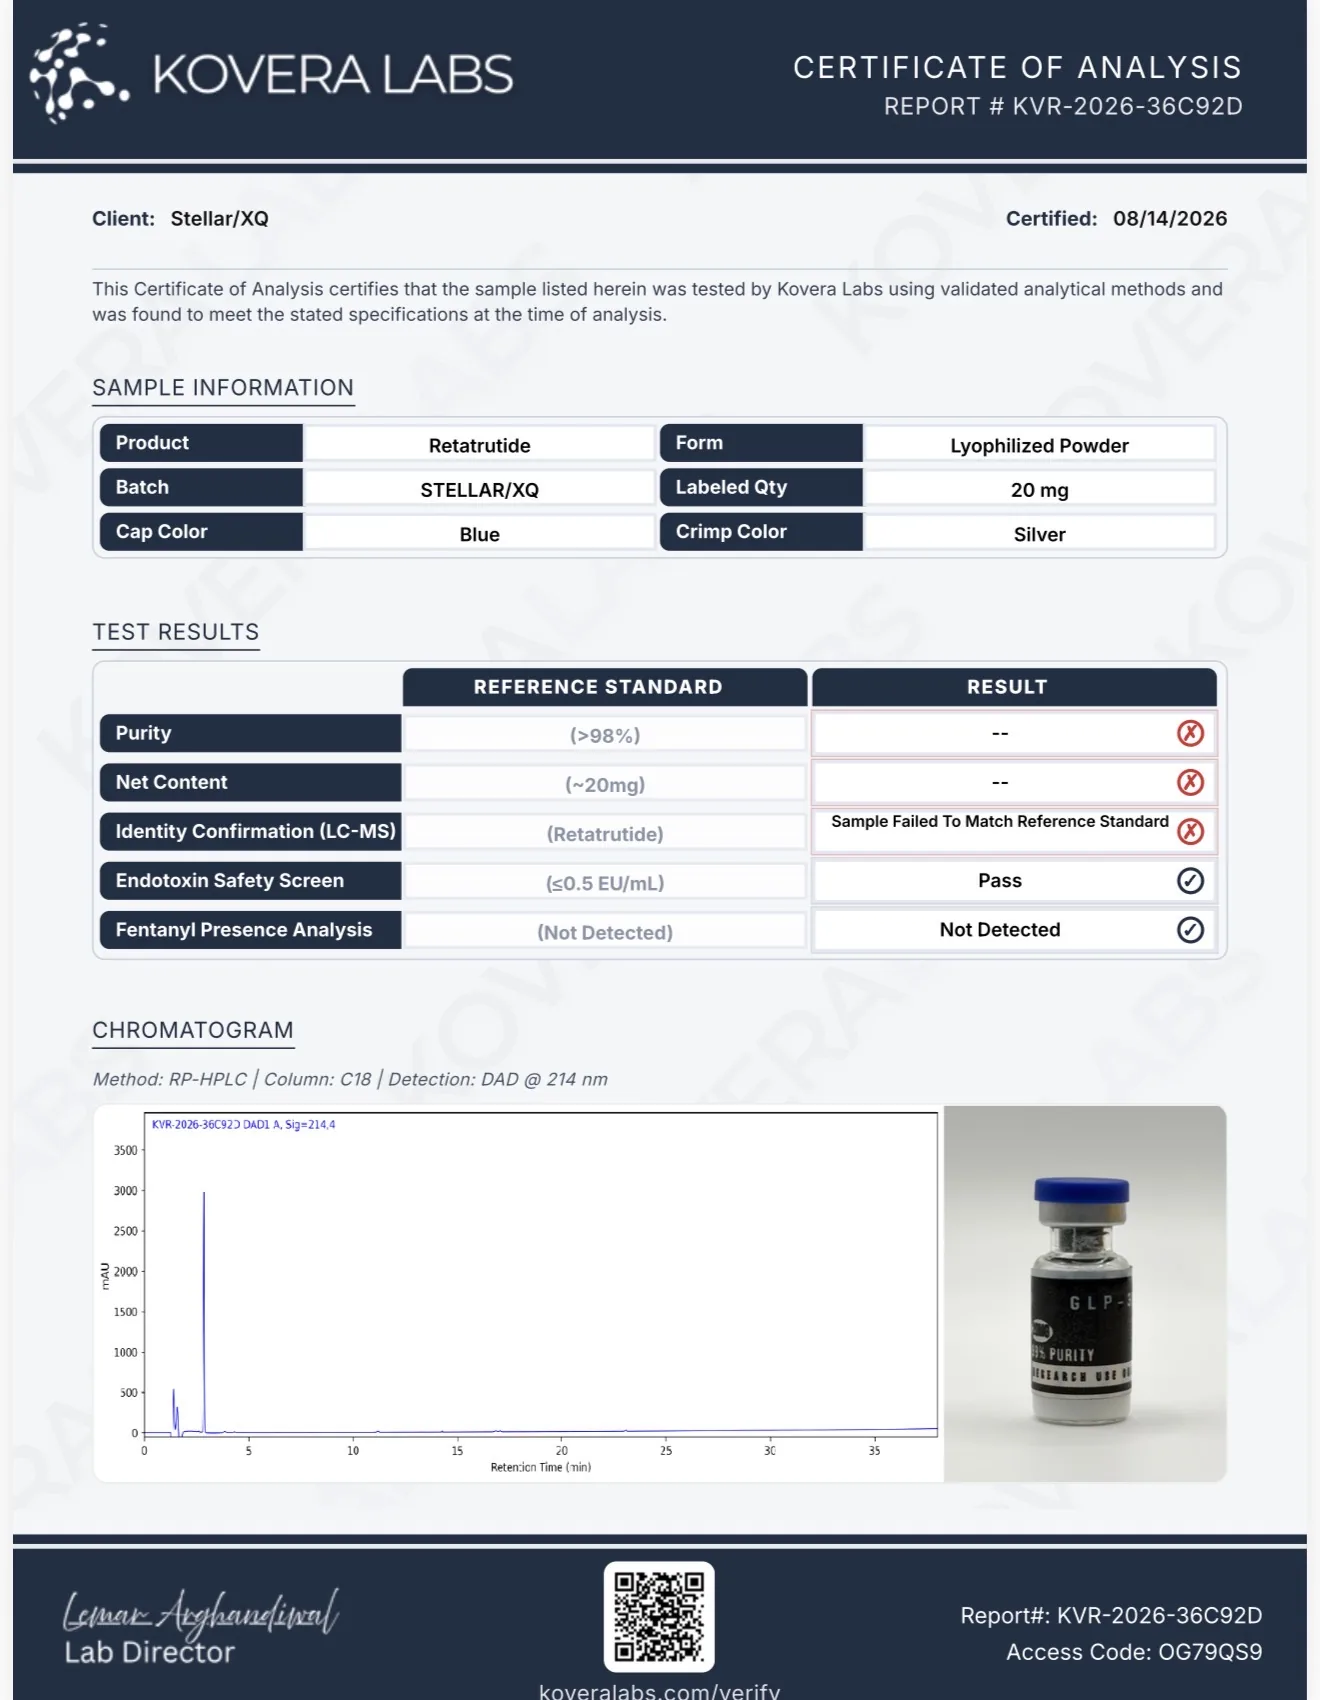
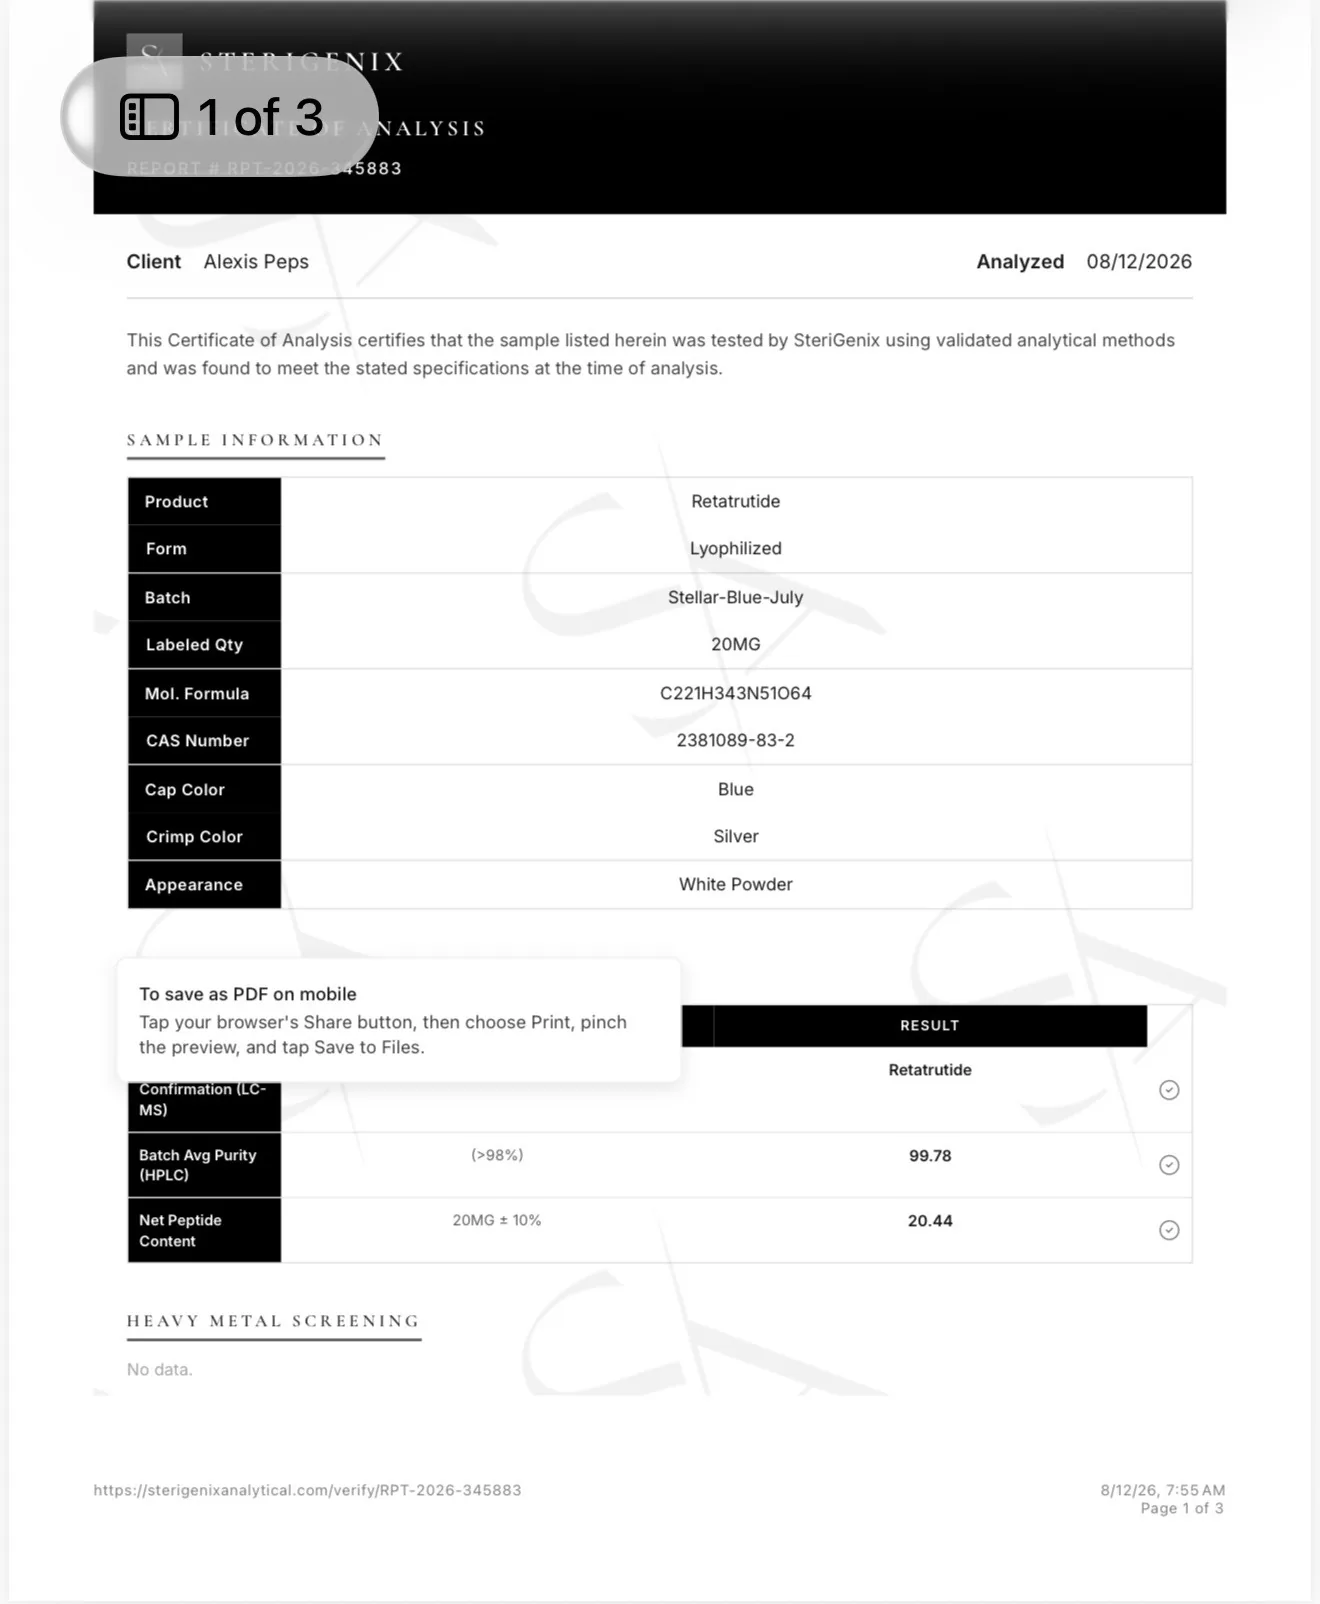
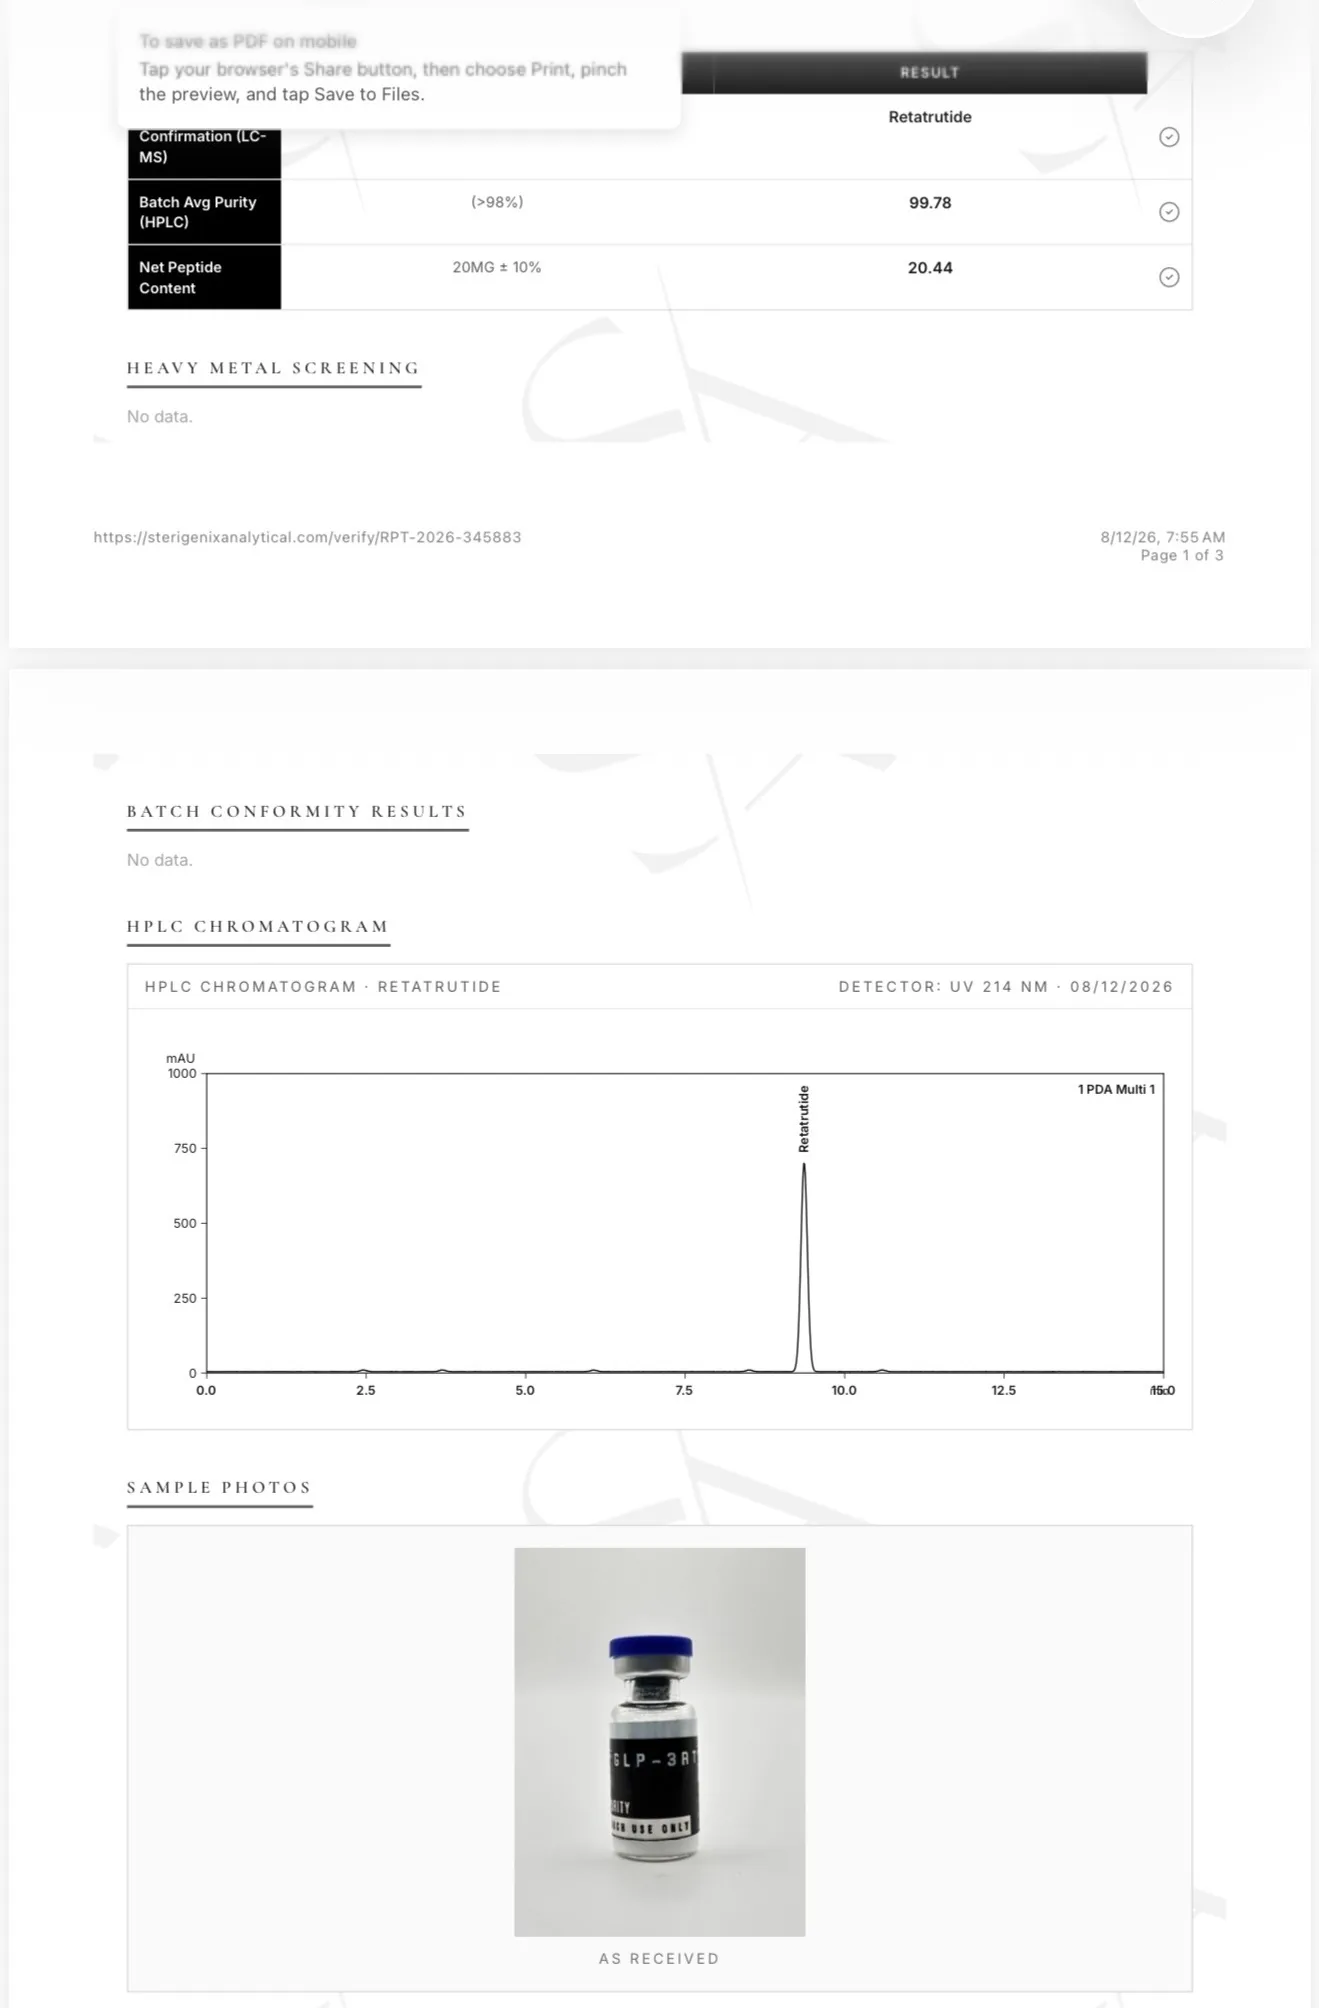
On 12 August 2026, SteriGenix identified a 20 mg blue-cap/silver-crimp sample as retatrutide, with 99.78% HPLC purity, 20.44 mg net peptide content and an LC-MS identity result of Retatrutide. Two days later, Kovera Labs issued a report for a 20 mg blue-cap/silver-crimp retatrutide sample from the same batch but a very different conclusion: its LC-MS identity test failed, with the report stating “Sample Failed To Match Reference Standard.”
Kovera subsequently compared the LC-MS data from what it described as the “Sterigenix passed batch” with data from a retatrutide sample that had passed its own testing. The profiles were markedly different.
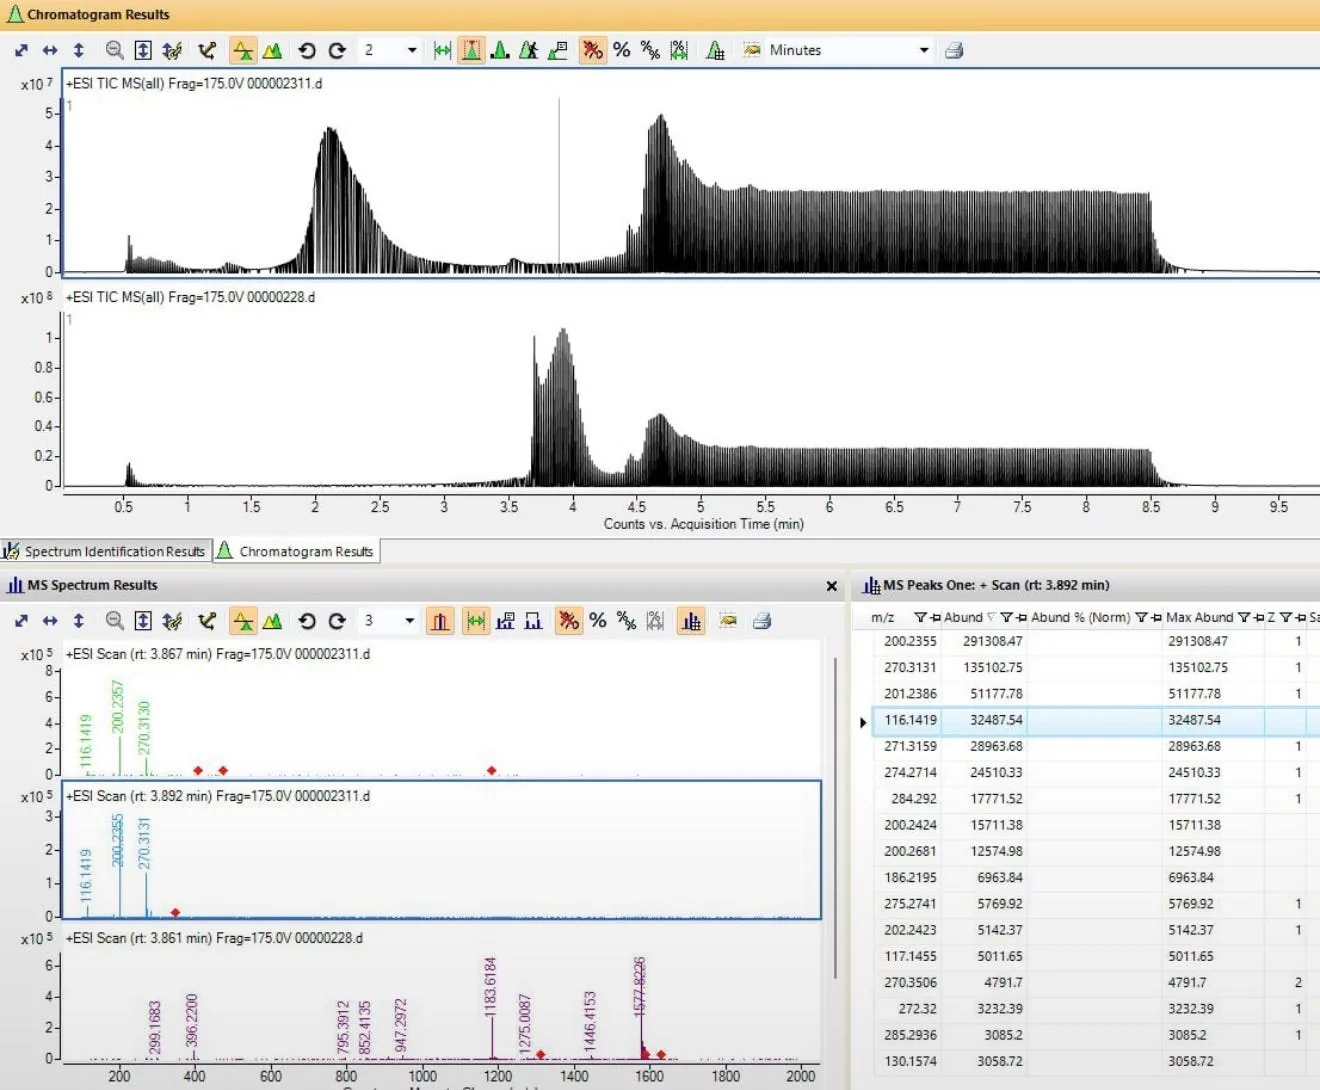
What this image shows: the two large graphs at the top are LC-MS total-ion chromatograms, showing the overall ion signal recorded during each run. They are visibly different, but the more important comparison is in the mass spectra underneath.
The SteriGenix-associated sample, shown in the upper spectra, is dominated by low-mass ions around 116, 200 and 270 m/z.
The passing retatrutide comparison sample, shown below, contains a series of much higher-mass ions, including signals around 947, 1184 and 1578 m/z. Those represent different charge states of a much larger peptide molecule and are consistent with the pattern expected from intact retatrutide.
So this wasn’t simply a disagreement over purity or quantity, SteriGenix identified the sample as retatrutide and passed it; Kovera’s LC-MS testing failed the corresponding Stellar sample against its retatrutide reference standard.
SteriGenix vs Freedom Diagnostics
The Freedom Diagnostics comparisons produced a more mixed picture.
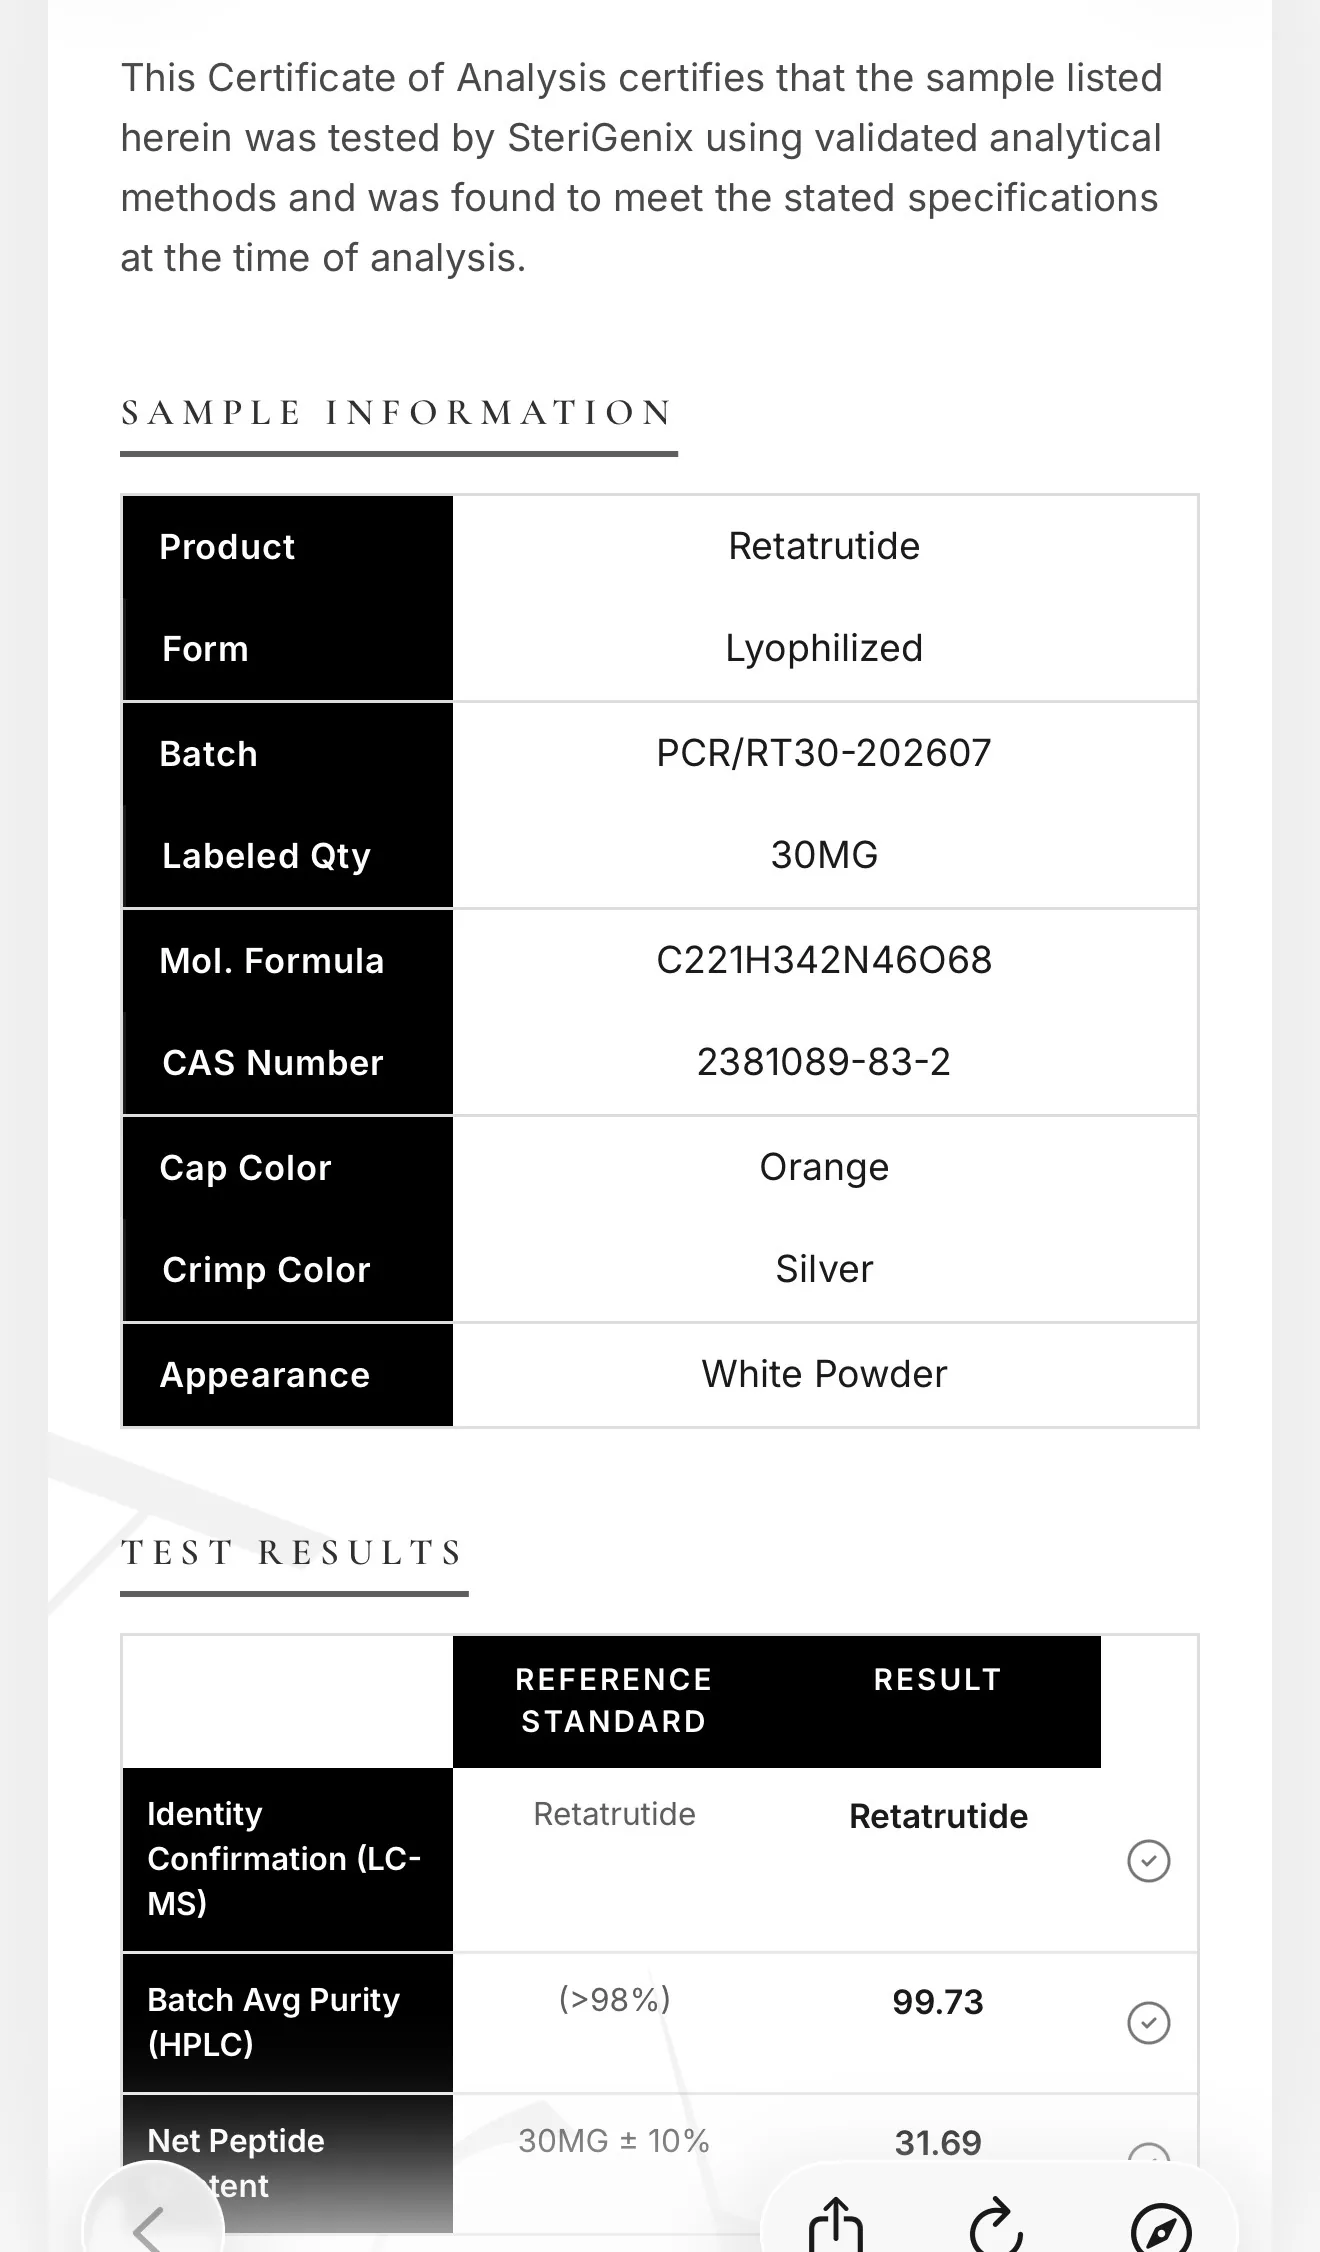
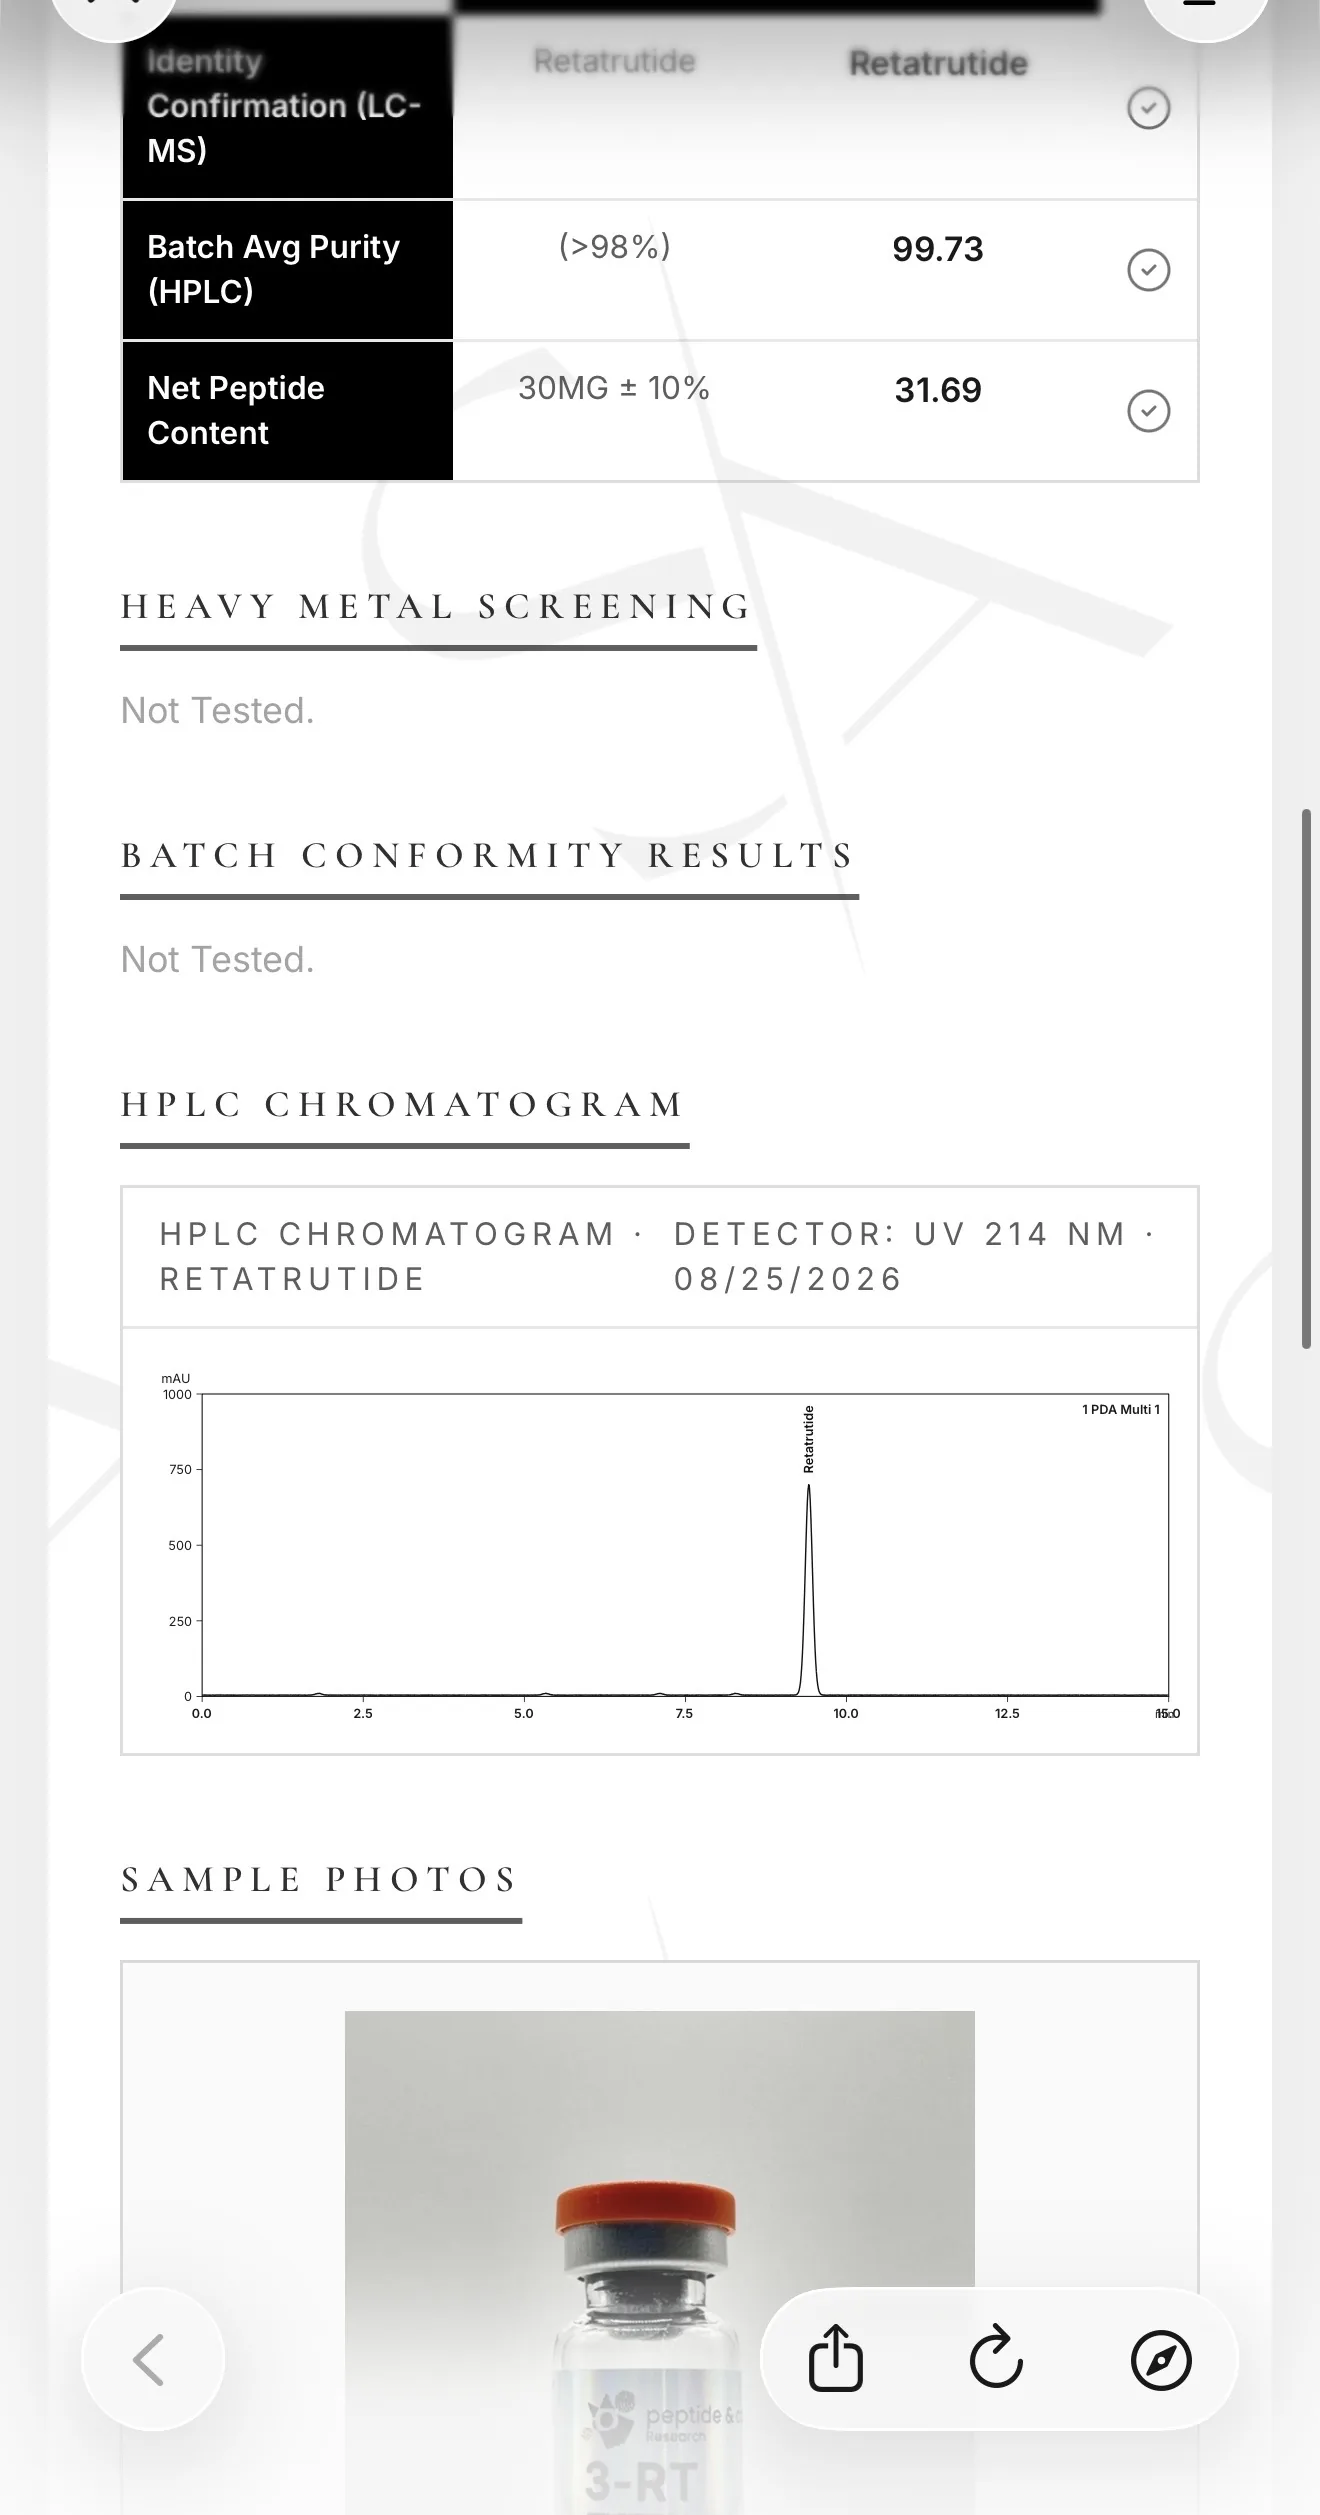
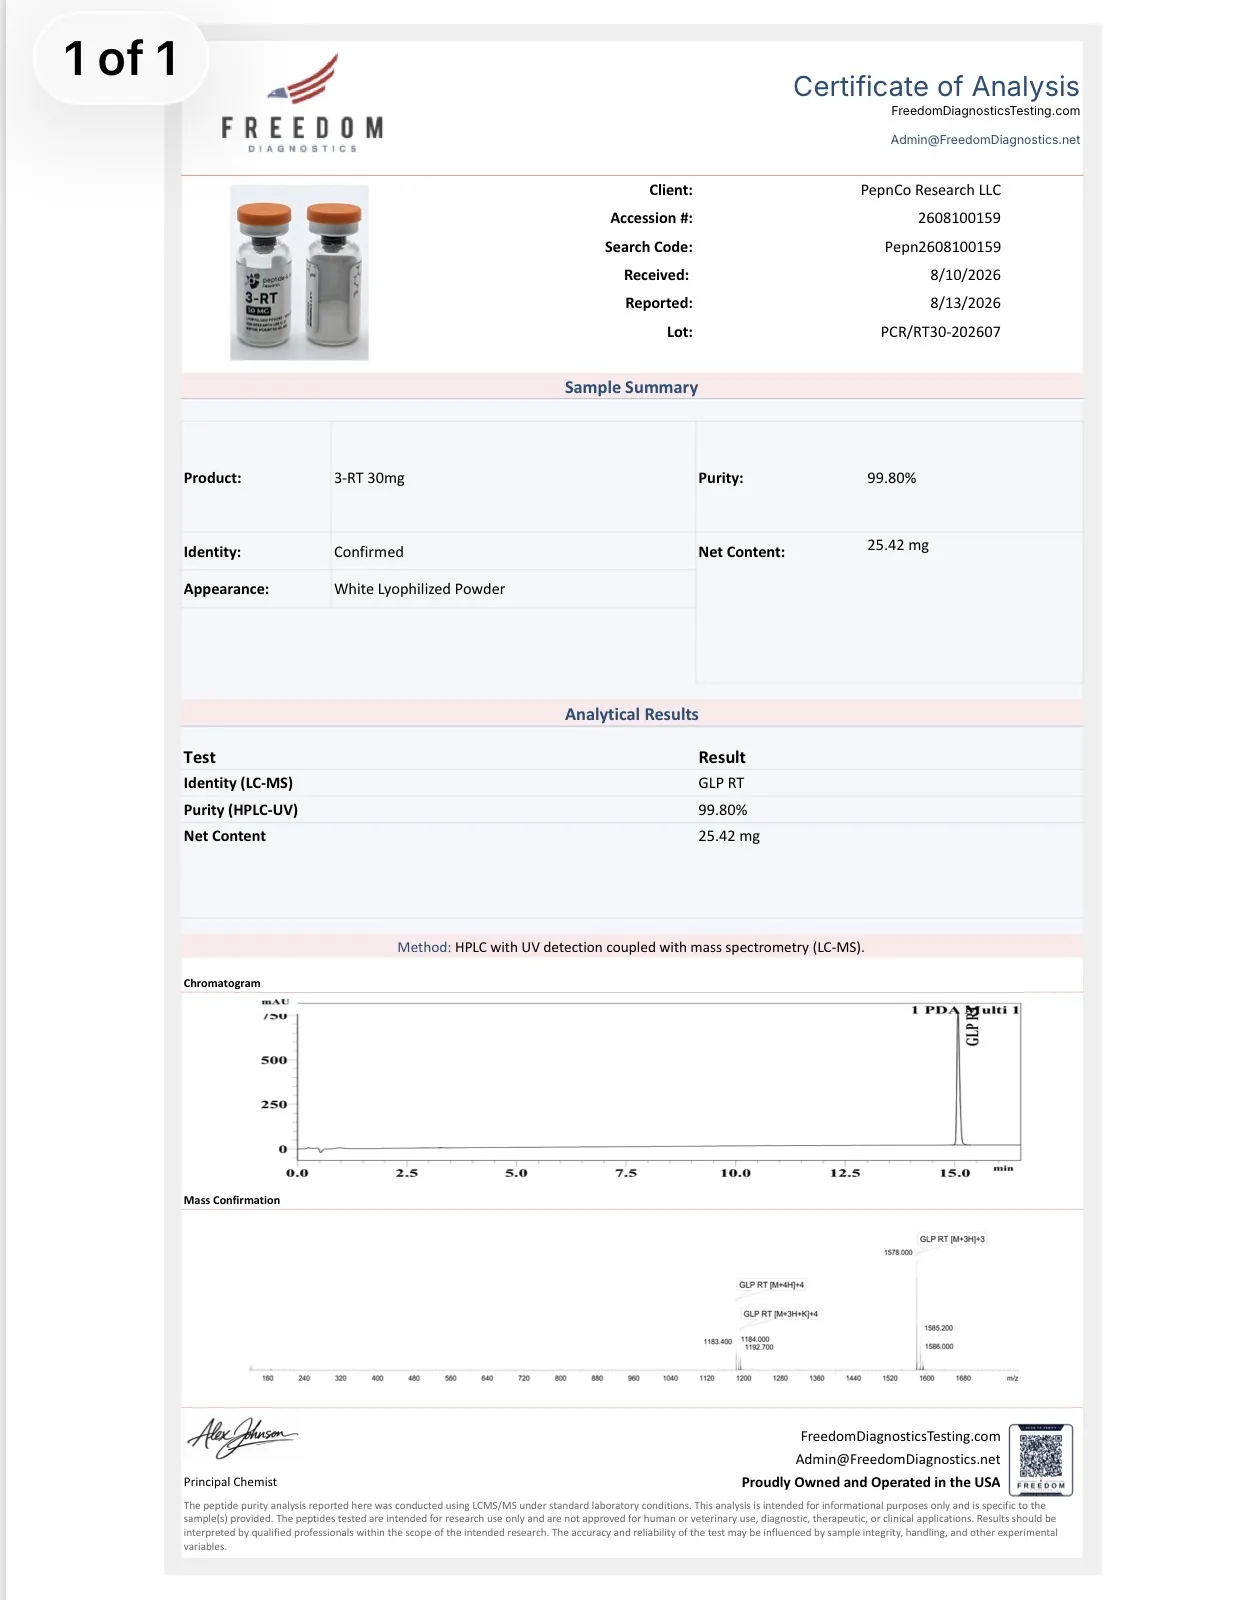
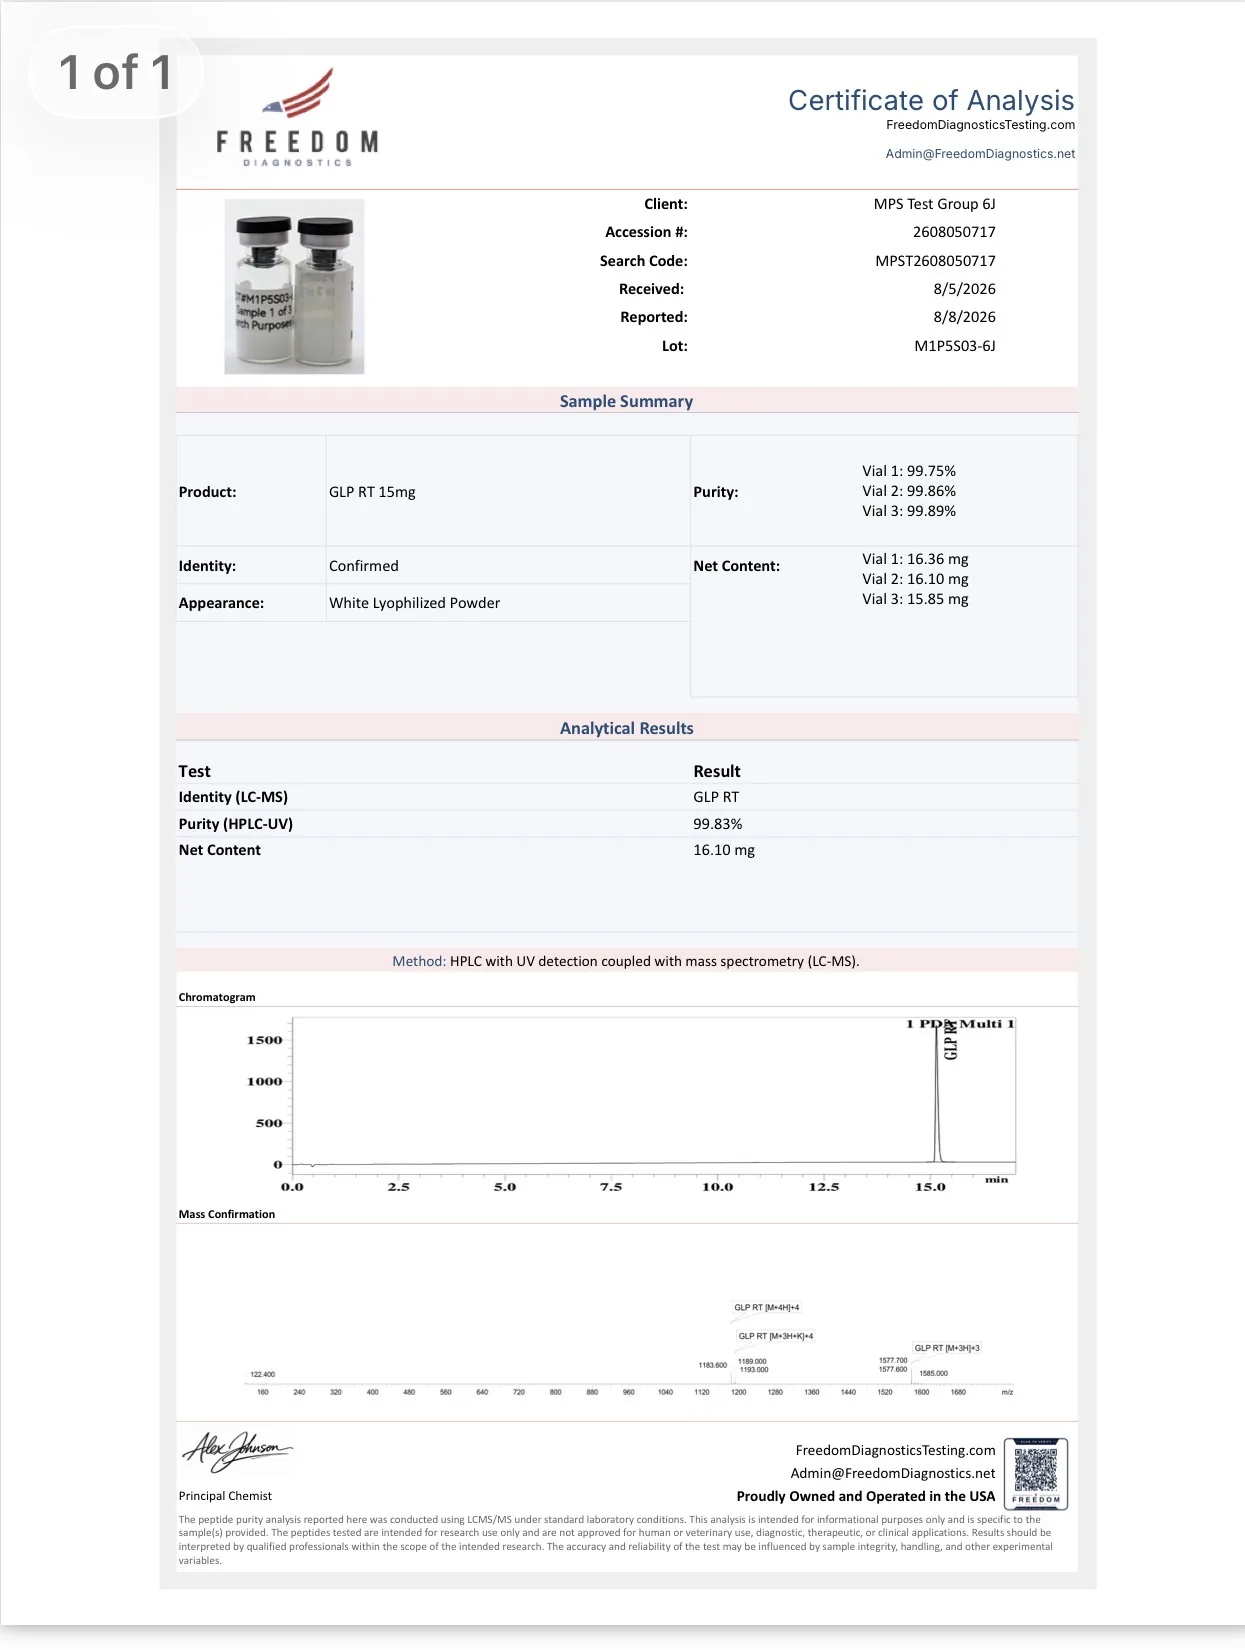
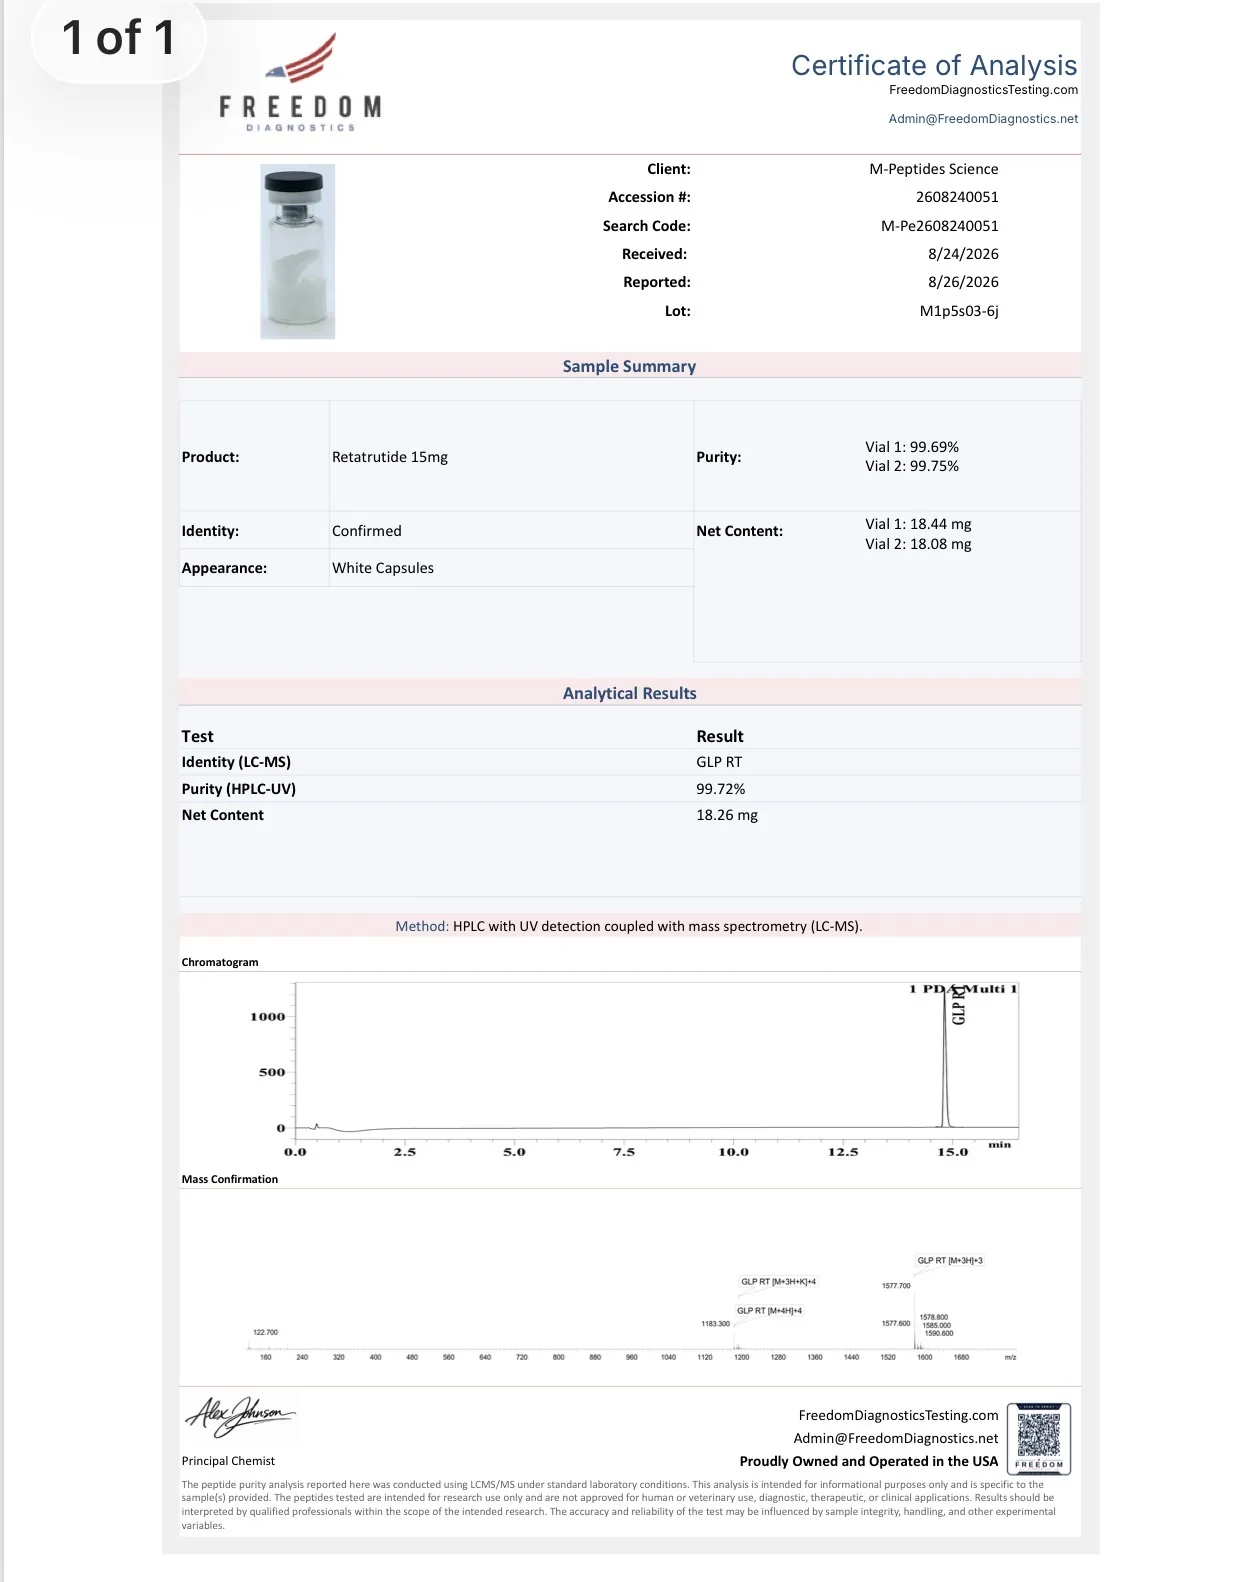
For a sample from batch PCR/RT30-202607, SteriGenix reported 31.69 mg of retatrutide, while Freedom reported 25.42 mg, a difference of 6.27 mg.
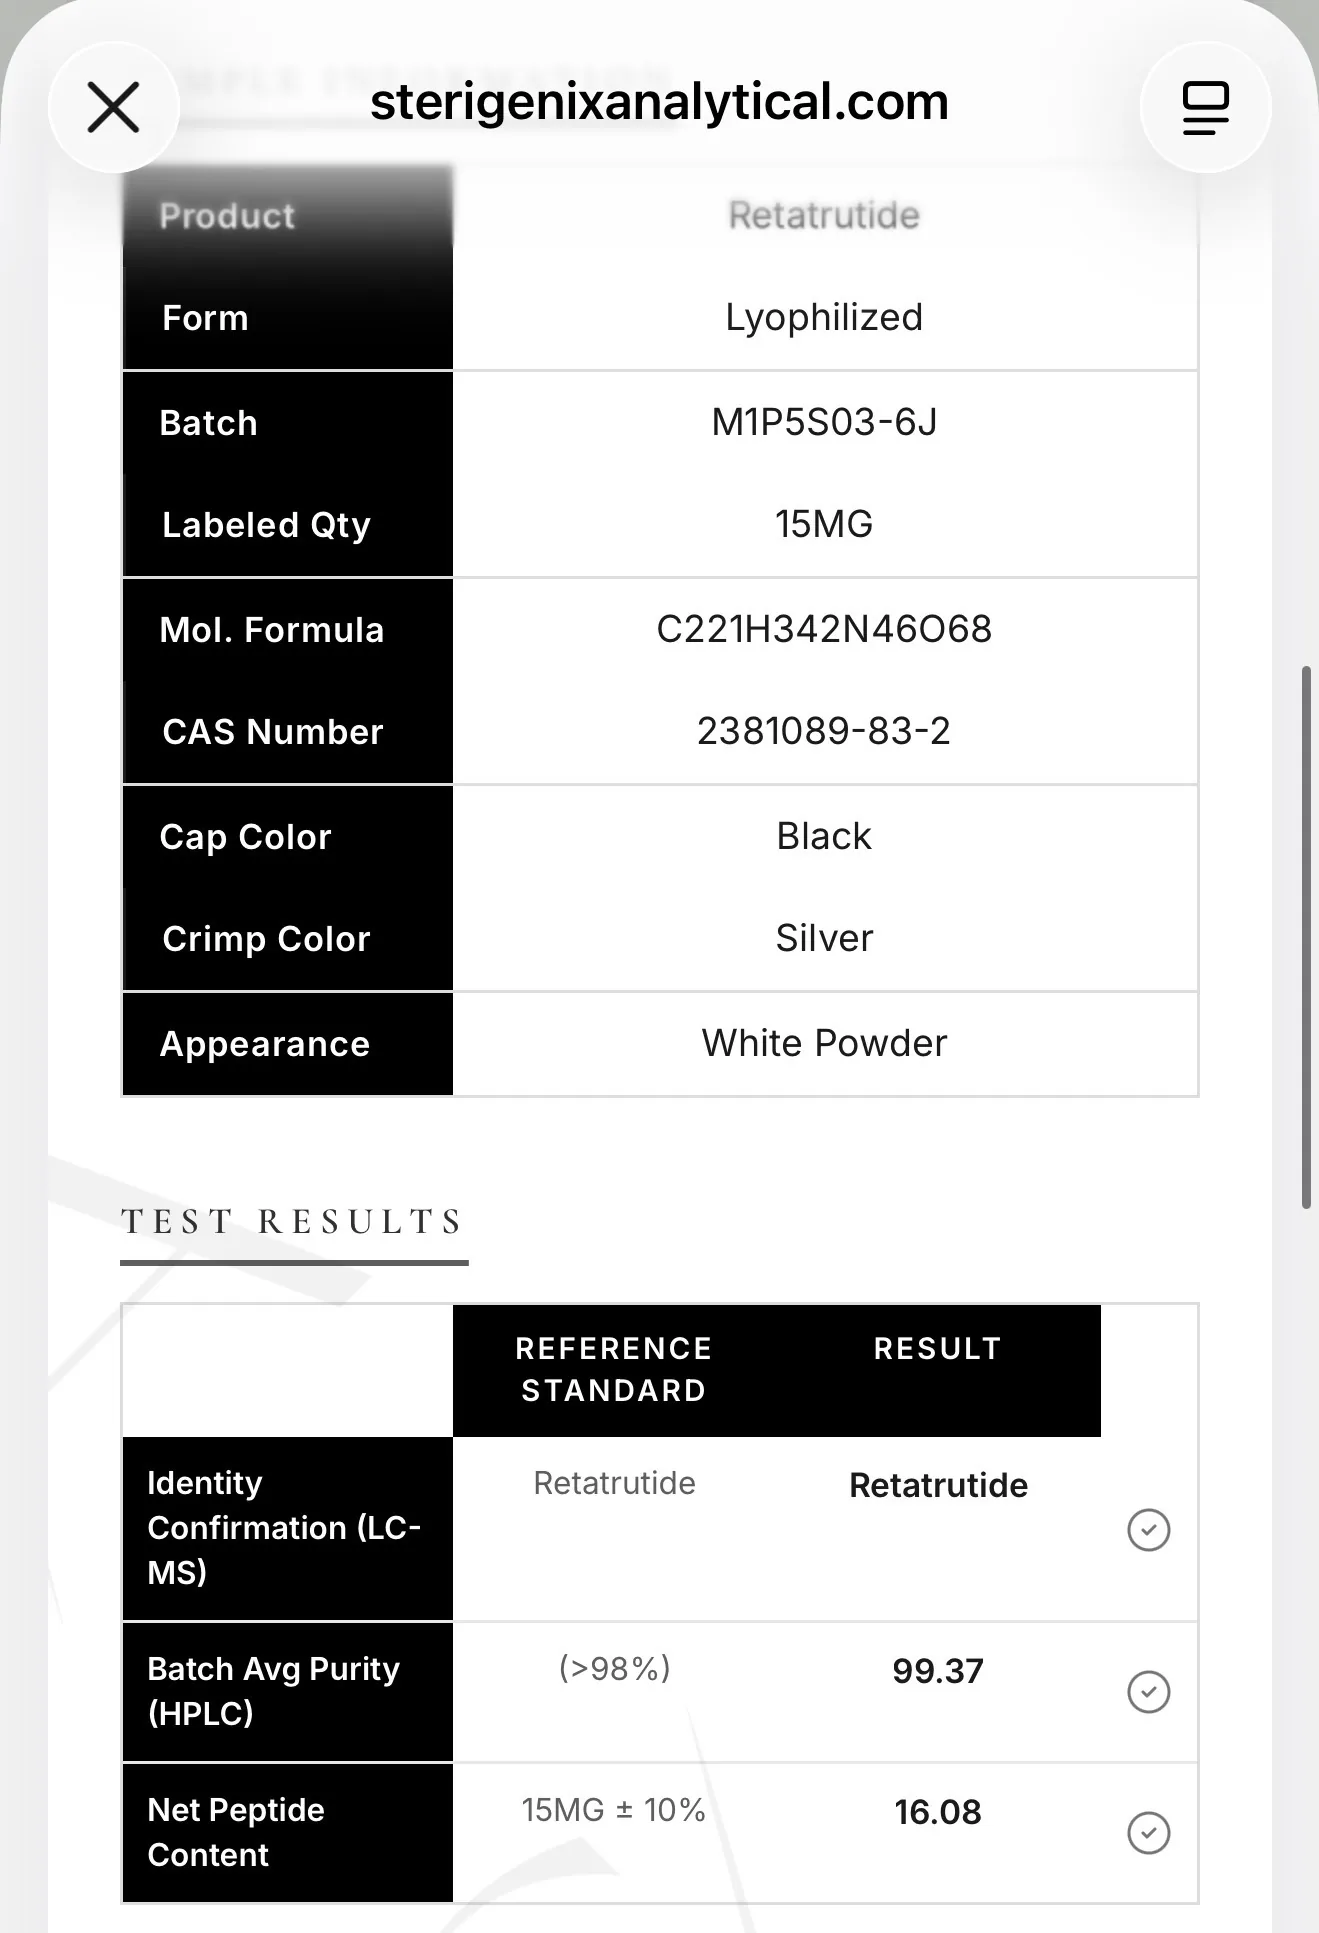
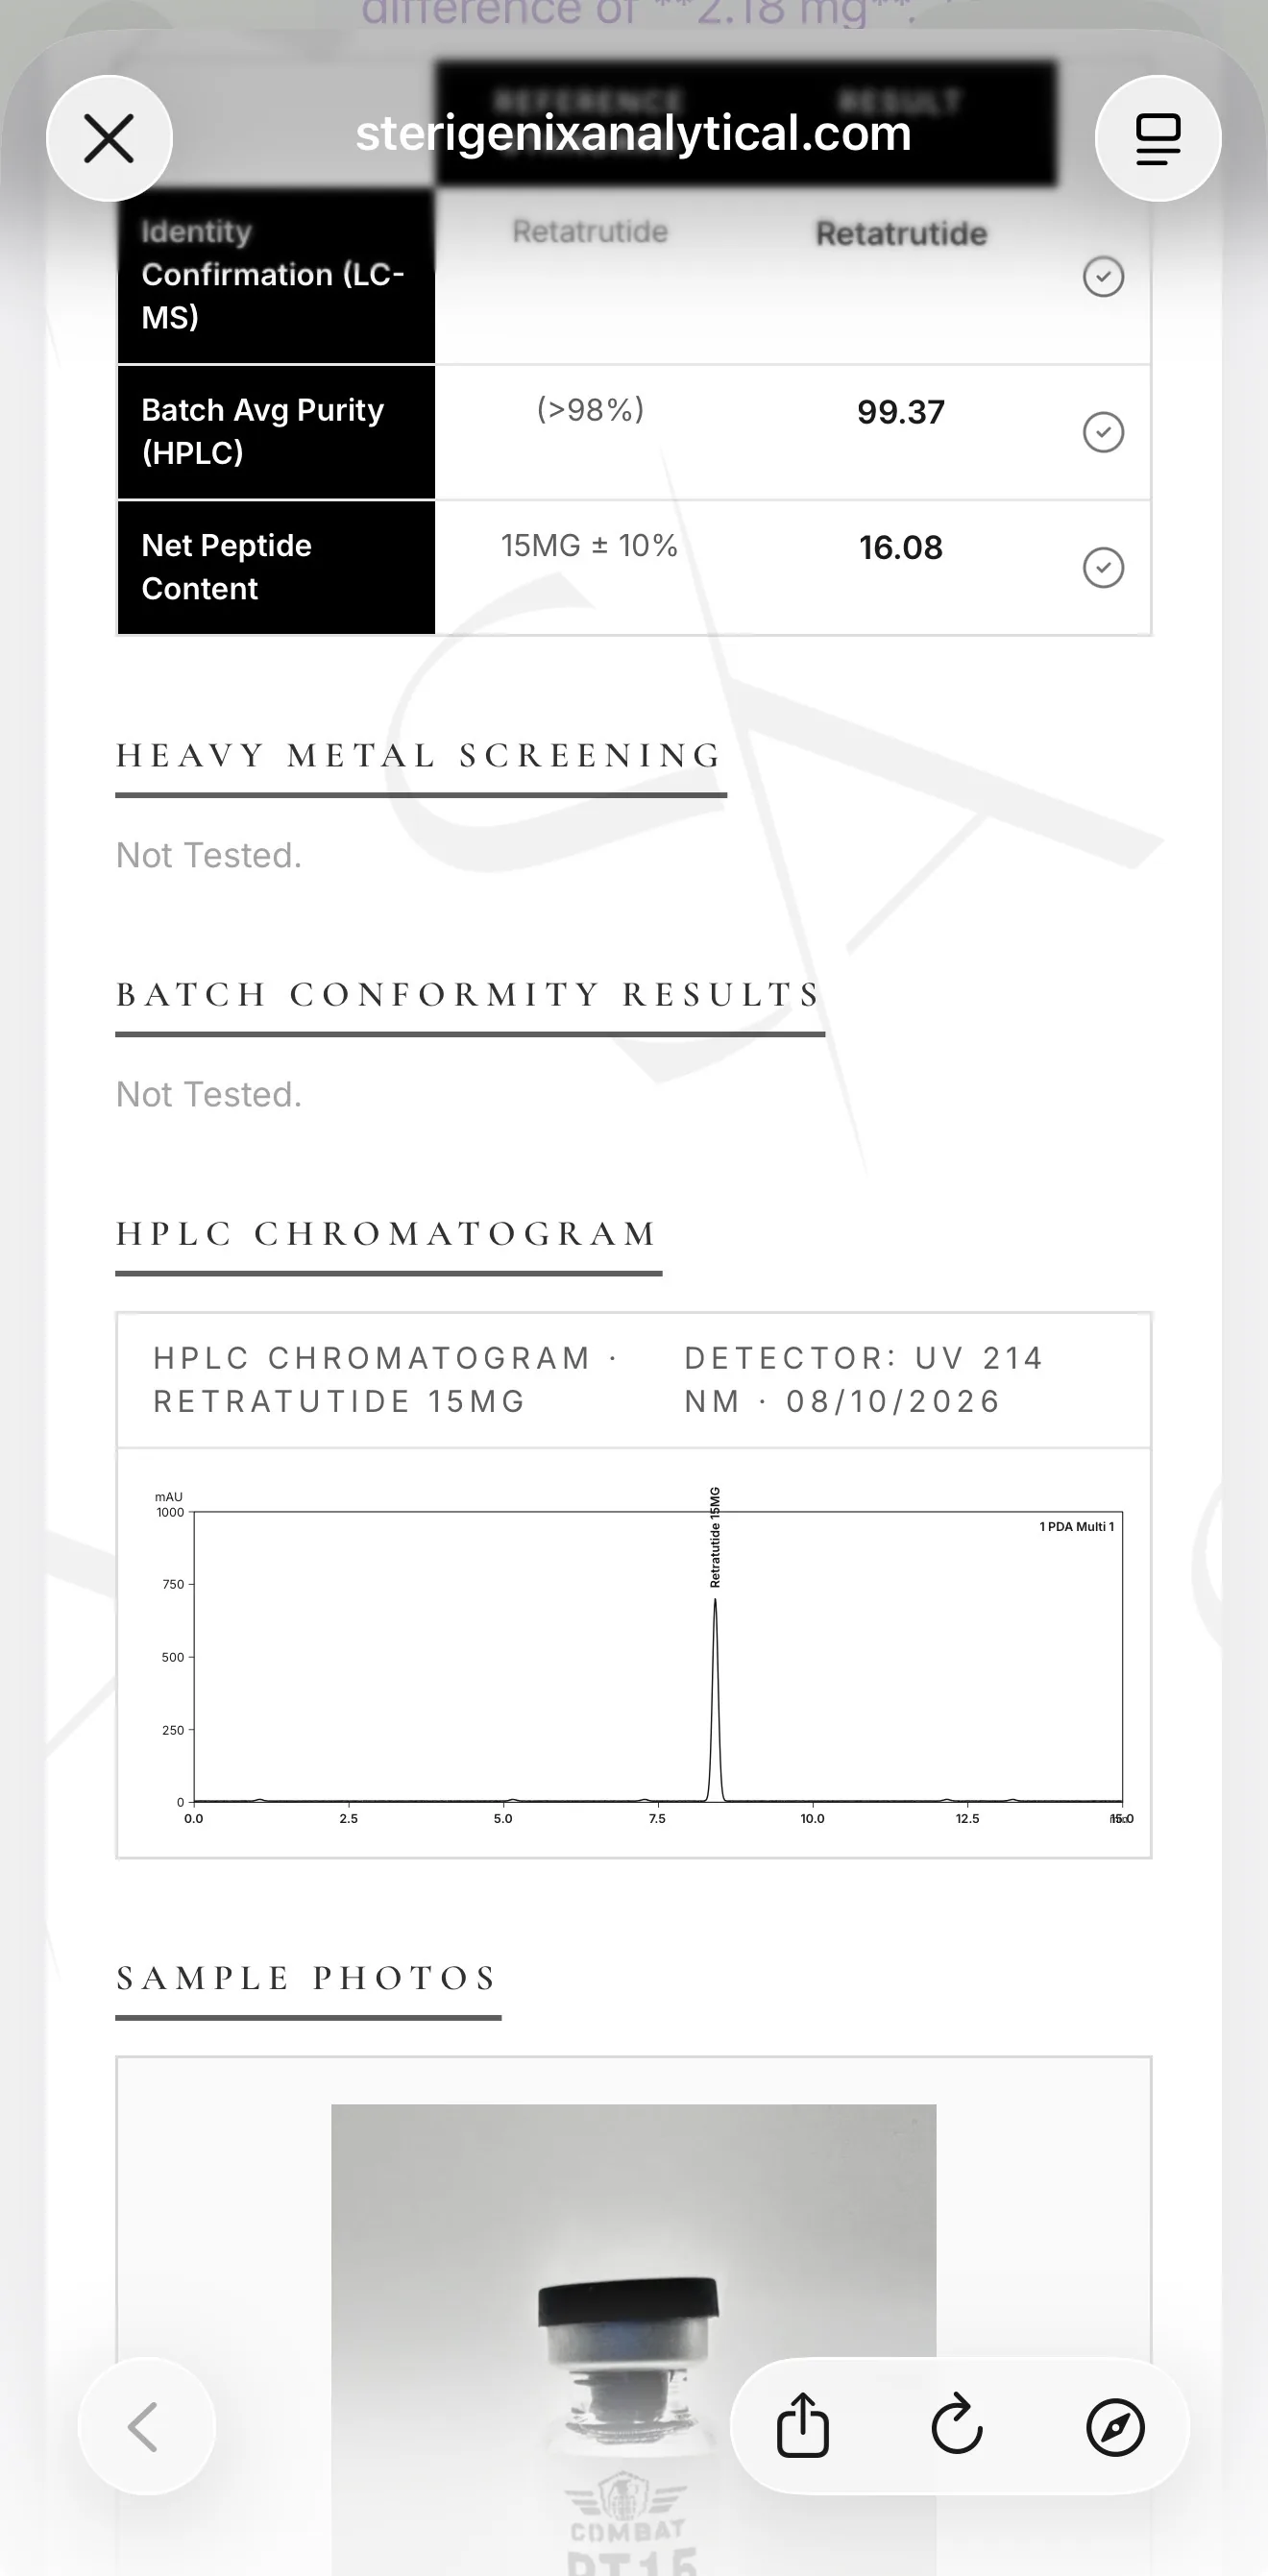
Another batch, M1P5S03-6J, produced three different measurements. SteriGenix reported 16.08 mg. Two Freedom reports associated with the same batch returned 16.10 mg and 18.26 mg. The first Freedom result was almost identical to SteriGenix, differing by just 0.02 mg. The second was 2.18 mg higher.
These show why cross-laboratory comparisons need context: some SteriGenix and Freedom results agreed almost exactly, while others carrying the same batch identifier differed substantially, and variation between vials or kits can’t be excluded either
What the 3,003-report database actually shows
Initial discussion around SteriGenix often reduced the concern to a crude allegation that the laboratory “passed everything.” That’s not accurate. Applying the corrected audit’s classification rules to the 3,003 reports produced 2,764 PASS, 177 FAIL and 62 UNKNOWN classifications. That corresponds to: 92.04% PASS, 5.89% FAIL and 2.06% UNKNOWN
The adverse results, however, were highly concentrated in one category. The audit identified 175 quantity deviations greater than 10%, but only three identity failures and two purity failures against the specification printed on the report. It found no endotoxin failures and no microbial failures.
Even the apparently low purity results need context. Forty-three reports fell below 98% purity, but 41 still met SteriGenix’s own stated specification. Most of those lower results were HGH samples around 95 to 97%, for which SteriGenix generally used a >95% purity specification. So the unusual feature isn’t that SteriGenix never reported poor results. It did, particularly for quantity. It’s that identity, purity, endotoxin and microbial failures were exceptionally rare compared with quantity failures.
Purity values themselves were also highly concentrated near 100%. A separate calculation by the source put median purity at around 99.6% after excluding HGH.
That is unusual enough to investigate, but it’s not proof of fabrication. Upstream screening, selection of better products, client behaviour and the population of samples submitted can all distort a public COA database. The renderer evidence is stronger precisely because it doesn’t depend on assumptions about what a “normal” grey-market purity distribution should look like.
A shutdown and an ownership transfer
The source says they sent their due-diligence concerns to SteriGenix shortly before the laboratory stopped accepting new work. Around the same period, SteriGenix said new orders and accounts were paused while the business underwent a transfer of ownership. The timing is notable, but there’s no evidence that the due-diligence material caused the change. The identities of the outgoing and incoming owners remain unresolved.
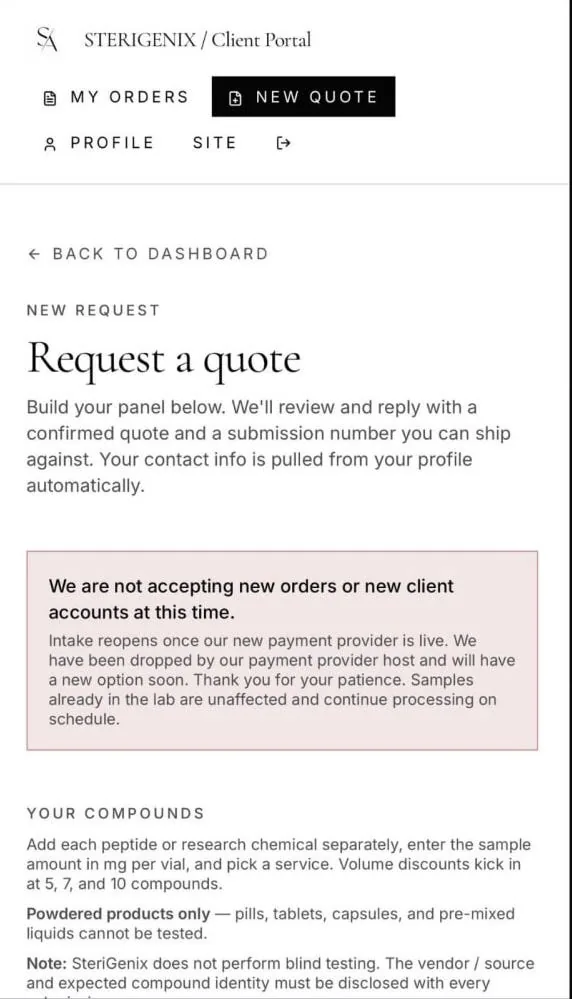
At one point, SteriGenix’s client portal also displayed a notice saying its payment provider had dropped it and that intake would reopen once a replacement provider was live. It said samples already in the laboratory were unaffected and would continue processing on schedule. When checked on 5 October 2026, the public Terms and Sample Submission pages attributed the pause to the ownership transfer. It remains unclear how the two explanations relate, or whether the payment-provider notice is still displayed inside the client portal.
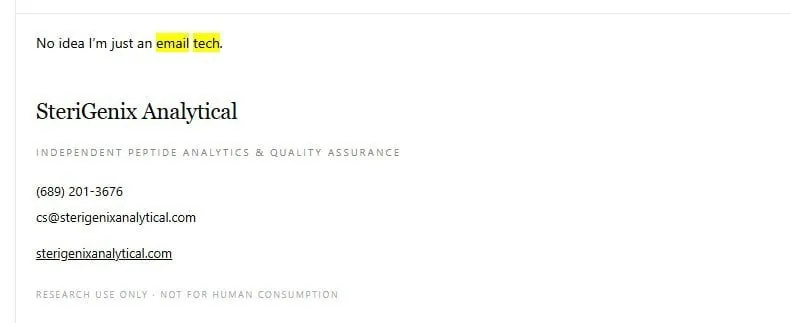
Long before the ownership-transfer announcement, the source said another problem had already become apparent: despite commissioning dozens of reports and exchanging detailed technical correspondence with SteriGenix, they never knew the identity of the person or people responding to them. In one earlier email from SteriGenix’s official customer-service address, the person replying described themselves simply as:
“No idea I’m just an email tech.”
Who was being paid?
The corporate trail raises another set of questions. Due-diligence material reviewed for this investigation says SteriGenix’s payment portal directed payment to HBF Group, LLC. Florida records show HBF Group was formed in 2019. The filings list May Calderon as registered agent and later manager, while Felipe Calderon appeared as manager in earlier years. But those filings don’t describe HBF as SteriGenix, a laboratory or an analytical-testing company, and contain no reference to peptides, HPLC, LC-MS or analytical chemistry.
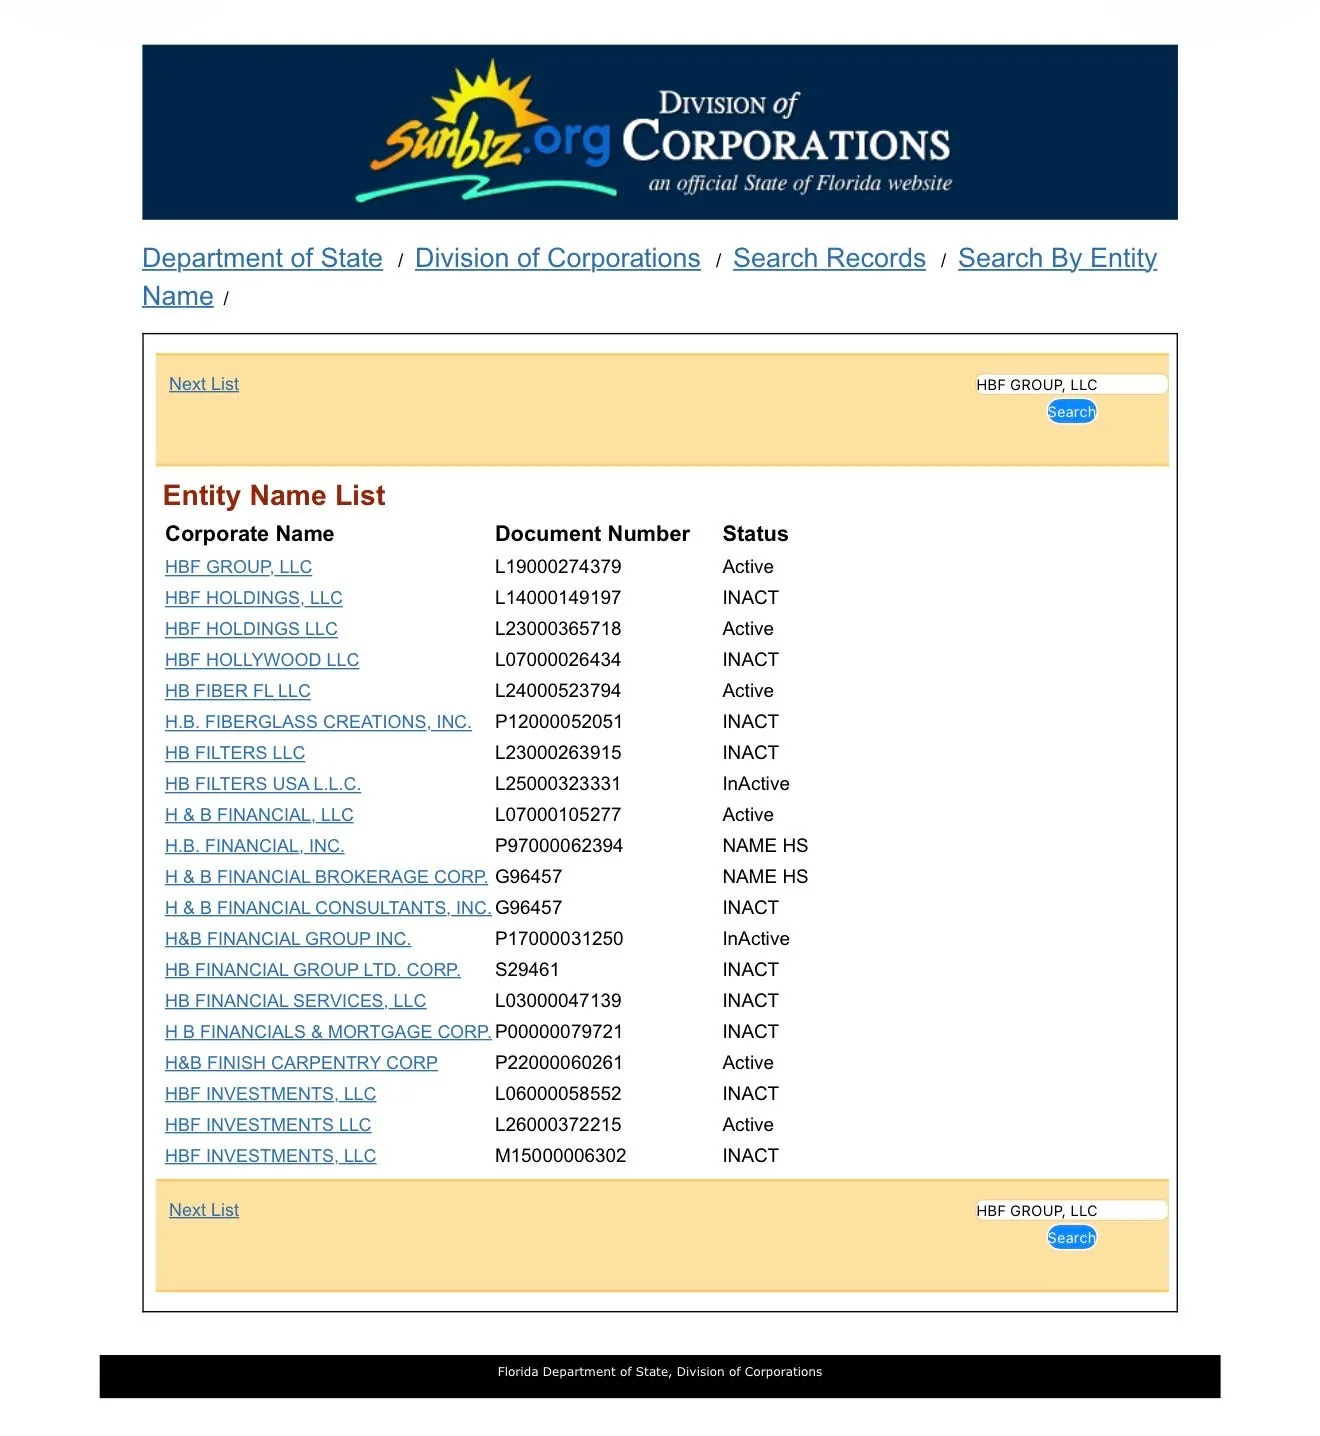
Above; Florida’s official corporate registry lists HBF Group LLC as an active company under document number L19000274379. The registry search itself doesn’t identify any connection to SteriGenix.
The same public-record review traced Felipe and/or May Calderon through several earlier Florida companies, including IF Enterprises, IT Food Group, Interamerica Commerce Group, Inter Oceanic Trading and Cosmogestion. Their documented business history was centred broadly on commerce, food, trading and management rather than analytical testing. Across the HBF and related-company filings reviewed, no SteriGenix or laboratory operation was identified.
That doesn’t establish wrongdoing. Private billing or agency arrangements may not appear in public corporate records, and Florida filings don’t necessarily disclose every commercial relationship. What remains unexplained is the legal connection. The review found no public filing showing that HBF owned SteriGenix, operated it, traded under its name or was formally authorised to collect payments for it. No SteriGenix fictitious-name registration tied to HBF was found either.
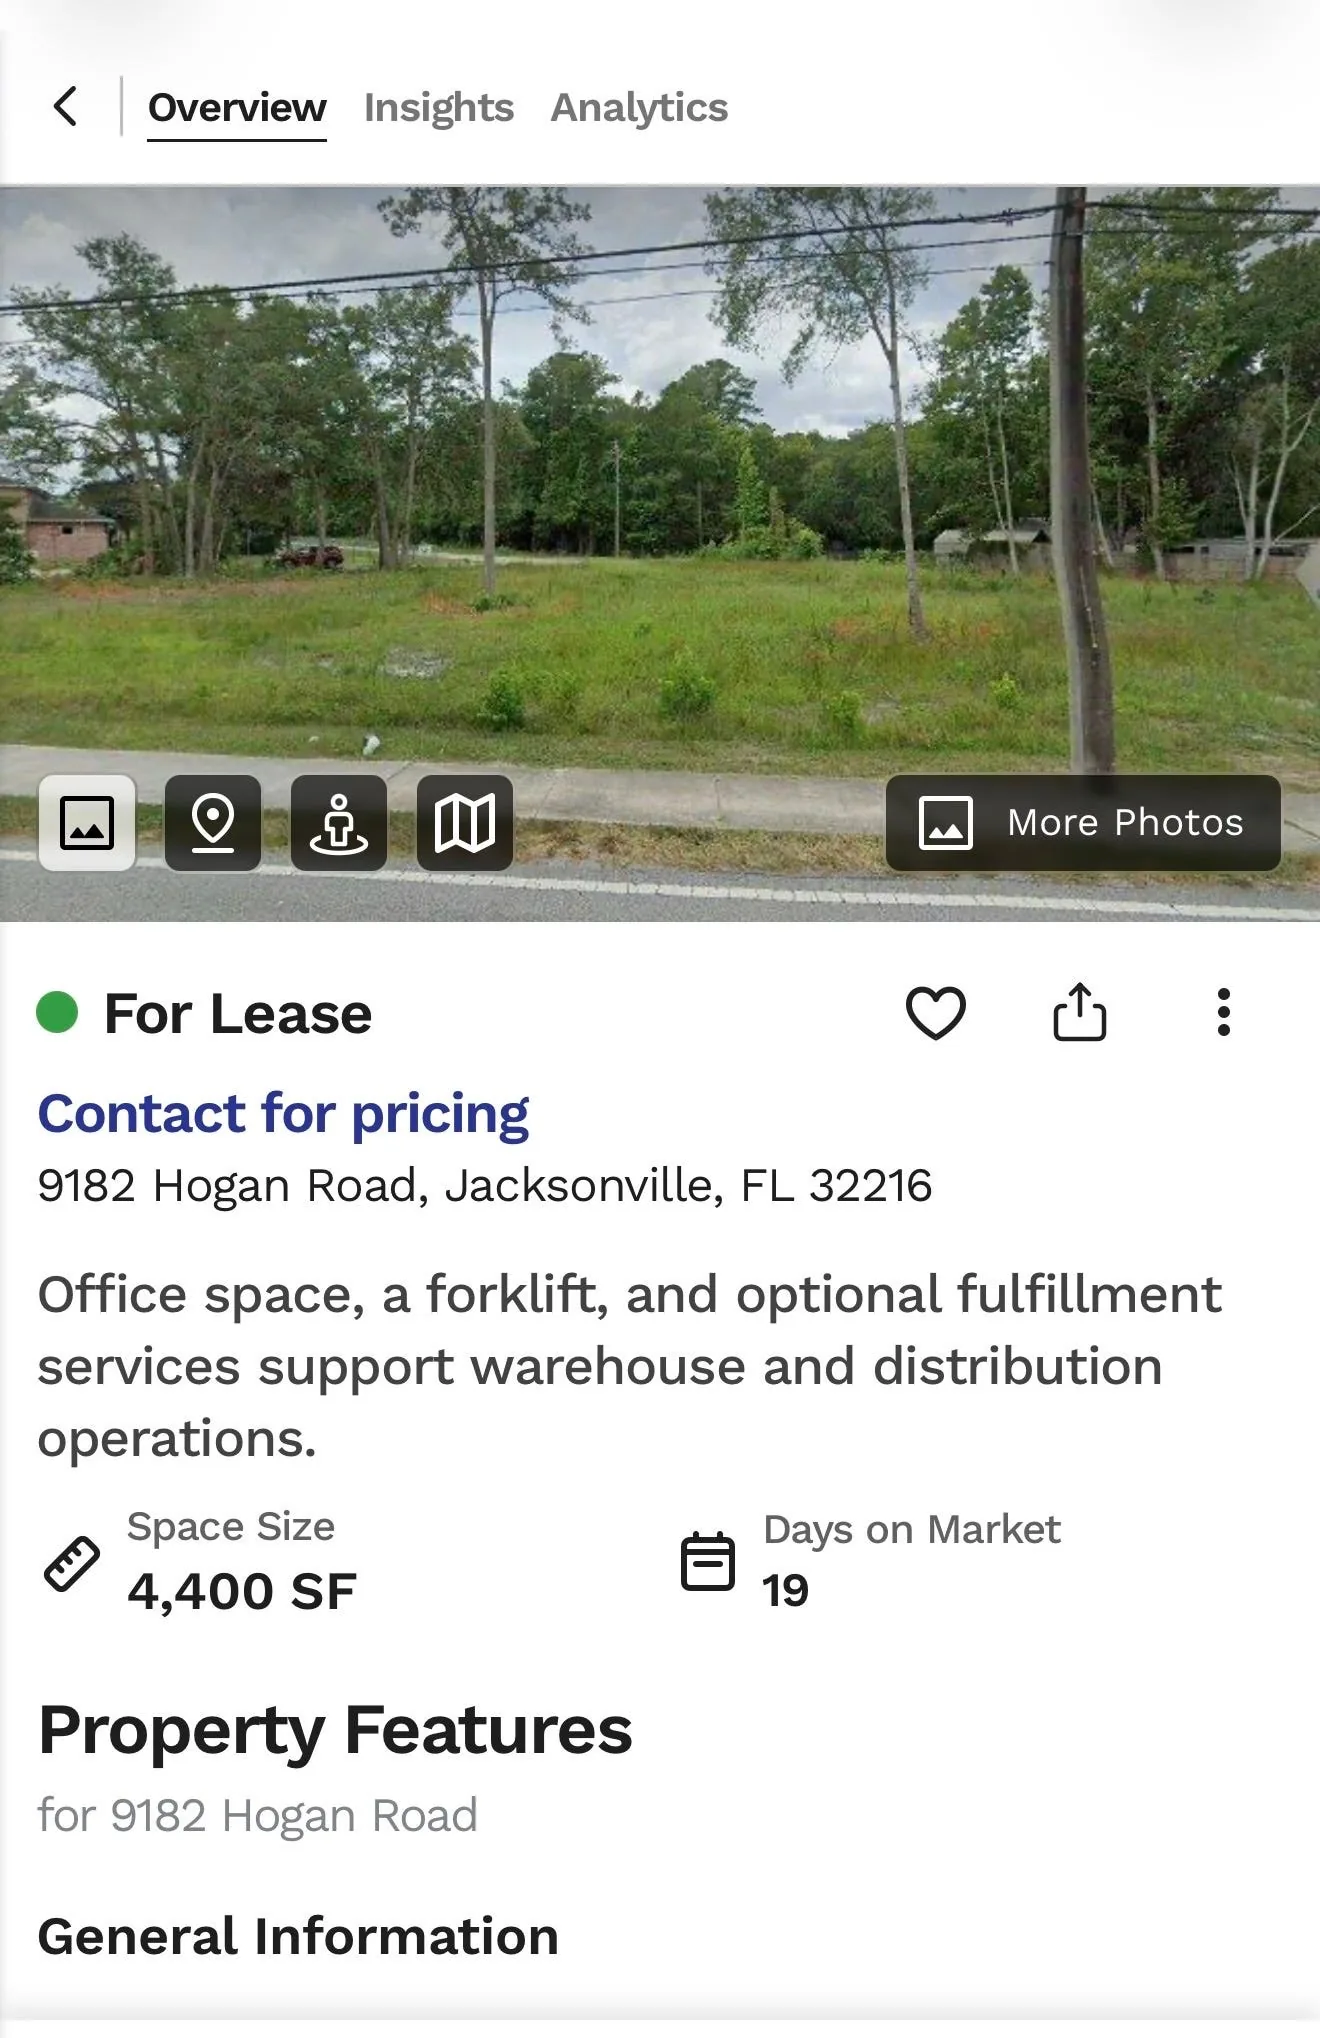
The payment material also listed 9182 Hogan Road in Jacksonville. Public property records describe it as commercial/warehouse space, while the due-diligence review notes that it was marketed as a roughly 4,400-square-foot industrial building. But the address did not appear in the HBF or related-company corporate filings reviewed, and no public occupancy record was found connecting SteriGenix or HBF to the property. Again, that does not prove SteriGenix was never there. Commercial occupancy can exist without appearing in corporate filings, but what remains is an unexplained chain:
SteriGenix reports → payments to HBF Group → a Jacksonville address → no public document yet located explaining how those pieces legally connect.
An unusually difficult operation to identify
The same difficulty appears when trying to establish who was actually carrying out the laboratory work. SteriGenix COAs name roles such as analyst, QC reviewer and QA director. But the public-record review did not establish how those people connected to HBF or to the wider business network. It also found no public evidence that the Calderons or the other identified business associates had analytical-laboratory qualifications. That doesn’t mean qualified laboratory staff did not exist. It means the public record reviewed did not identify them.
For a business issuing reports claiming HPLC, LC-MS, endotoxin and other analytical testing, some fairly basic questions therefore remain difficult to answer: who operated the instruments, who supervised the laboratory, who performed the quality review, and which legal entity employed or contracted those people?
The earlier customer correspondence adds to that uncertainty. The source said SteriGenix’s responders didn’t identify themselves, even during detailed technical exchanges. The issue is therefore broader than one anonymous email. The reports are visible. The corporate and personnel structure behind them is much harder to establish.
There are also unresolved chronology problems
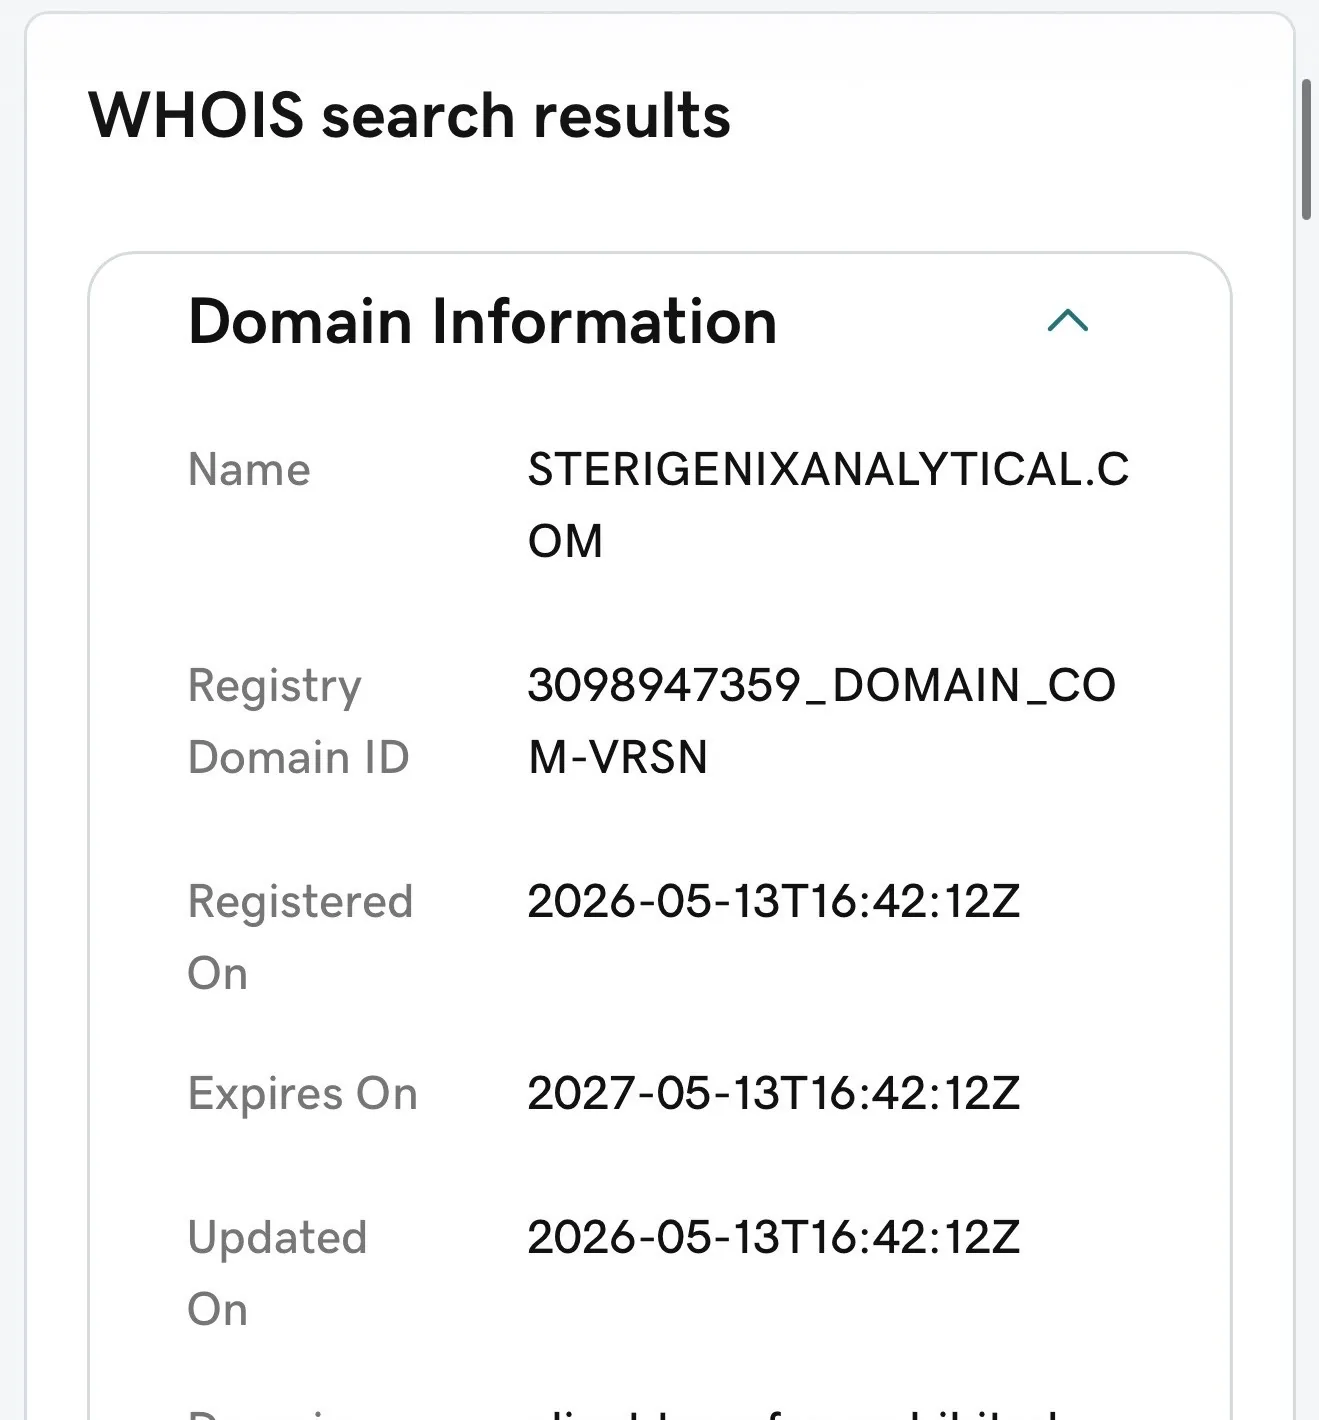
A WHOIS search shows sterigenixanalytical.com registered on 13 May 2026, yet the reconstructed report inventory contains at least one SteriGenix report carrying a test date of 26 March 2026. The website’s current Terms and Privacy pages also identify themselves as “Updated January 2026.” SteriGenix None of those facts proves backdating. The company could have existed before the domain. Reports could have been migrated from an earlier system. Legal documents could carry internal dates unrelated to publication.
But the chronology isn’t presently explained. The portal was also changing rapidly in August. A preserved public index grew from 2,426 reports on 15 August to 3,021 by 28 August. Some reports that appeared only in the later snapshot carried test dates from before the earlier snapshot. This shows that records were still being added to the public index, including some carrying earlier test dates. The reason is unknown.
This investigation doesn’t show that SteriGenix invented every result or never carried out genuine testing. In fact, three same-kit comparisons produced very similar purity and quantity results at independent laboratories. What it does establish is different: the chromatograms shown on SteriGenix’s public COAs were generated from report information rather than the HPLC detector data, and some supporting documentation contained template material that SteriGenix itself acknowledged did not describe the submitted samples.
The question SteriGenix still needs to answer
What analytical work actually sat behind these results?
All 20 preserved chromatograms available for direct comparison were reproduced exactly from report information, without supplying measured HPLC detector data. SteriGenix also acknowledged that supporting packets contained procedural wording and vial weights taken from a template rather than the submitted samples. Some numerical results closely matched independent laboratories. Others differed substantially, and the Kovera comparison raised a more fundamental disagreement over retatrutide identity. Accurate numbers in some cases don’t explain why the accompanying chromatograms were generated by reporting software rather than plotted from instrument measurements.
The business itself remains difficult to identify. Payments were reportedly directed to HBF Group, LLC, but its legal relationship to SteriGenix remains unresolved. SteriGenix has cited both a lost payment provider and an ownership transfer when explaining its intake pause, without identifying the outgoing or incoming owners.
SteriGenix says it retains raw laboratory data for three years. Those records, and a clear account of who performed the testing and who is responsible for it, are what would answer the remaining questions.
Comments