
Lobster thought he’d found a fairly simple problem. He says his HGH is produced in runs of around 6,000 kits at a time, with one large batch sold until it is gone. In his view, large batches give the maximum conformity and consistency of product. Customers and group-buy organisers then send their own samples for testing. Recently, though, he started noticing results he didn’t expect. Earlier HGH tests were often coming back around the high-97% range, while some newer COAs were showing results closer to 95 to 96% purity, along with measurable dimer and related proteins. Lobster’s first thought was that he might have mixed up the batches himself. He says he went back through shipping labels, warehouse records and dates to check. According to him, the tests really were from the same production batches. So he decided to try something more interesting.
Same batch wasn’t enough. He went back to the same kit.
Lobster contacted a customer who’d previously tested his 15 IU HGH and asked whether he still had product remaining from the exact same kit and fortunately, he did. The customer created a new account and didn’t label it Lobster, shipped it express and it was delivered in around 3 days. Lobster presented the results as a simple comparison: Same HGH. Same production batch. Same exact kit. Different submission.
The Two HGH COAS 26 days apart
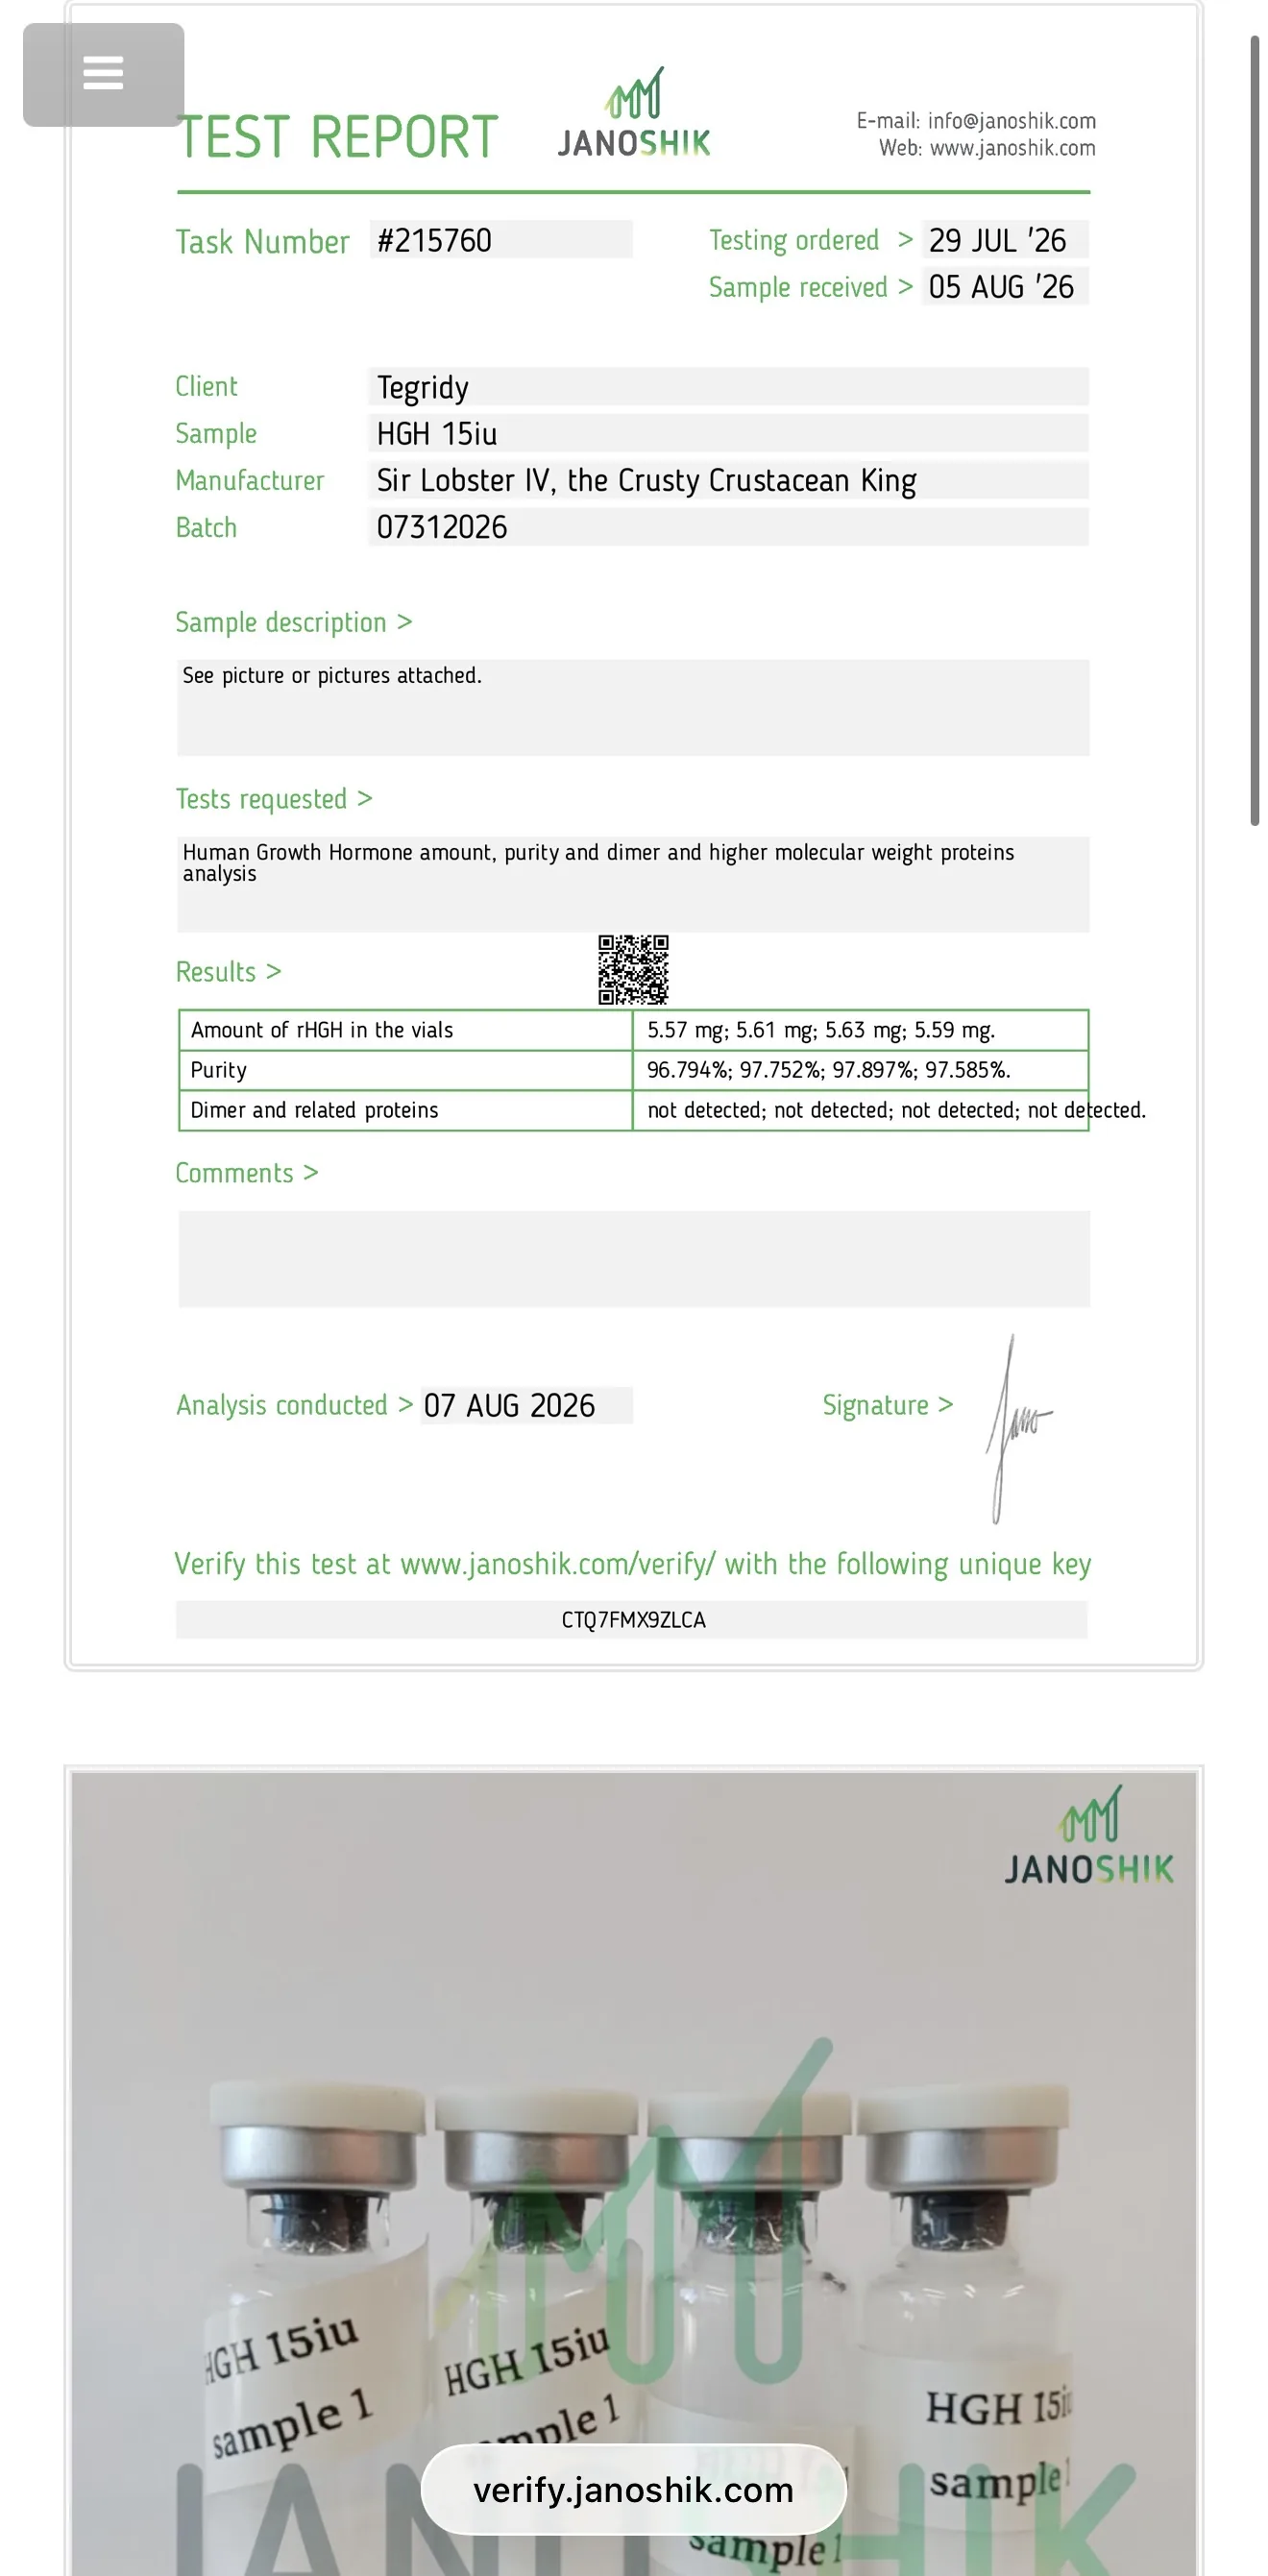
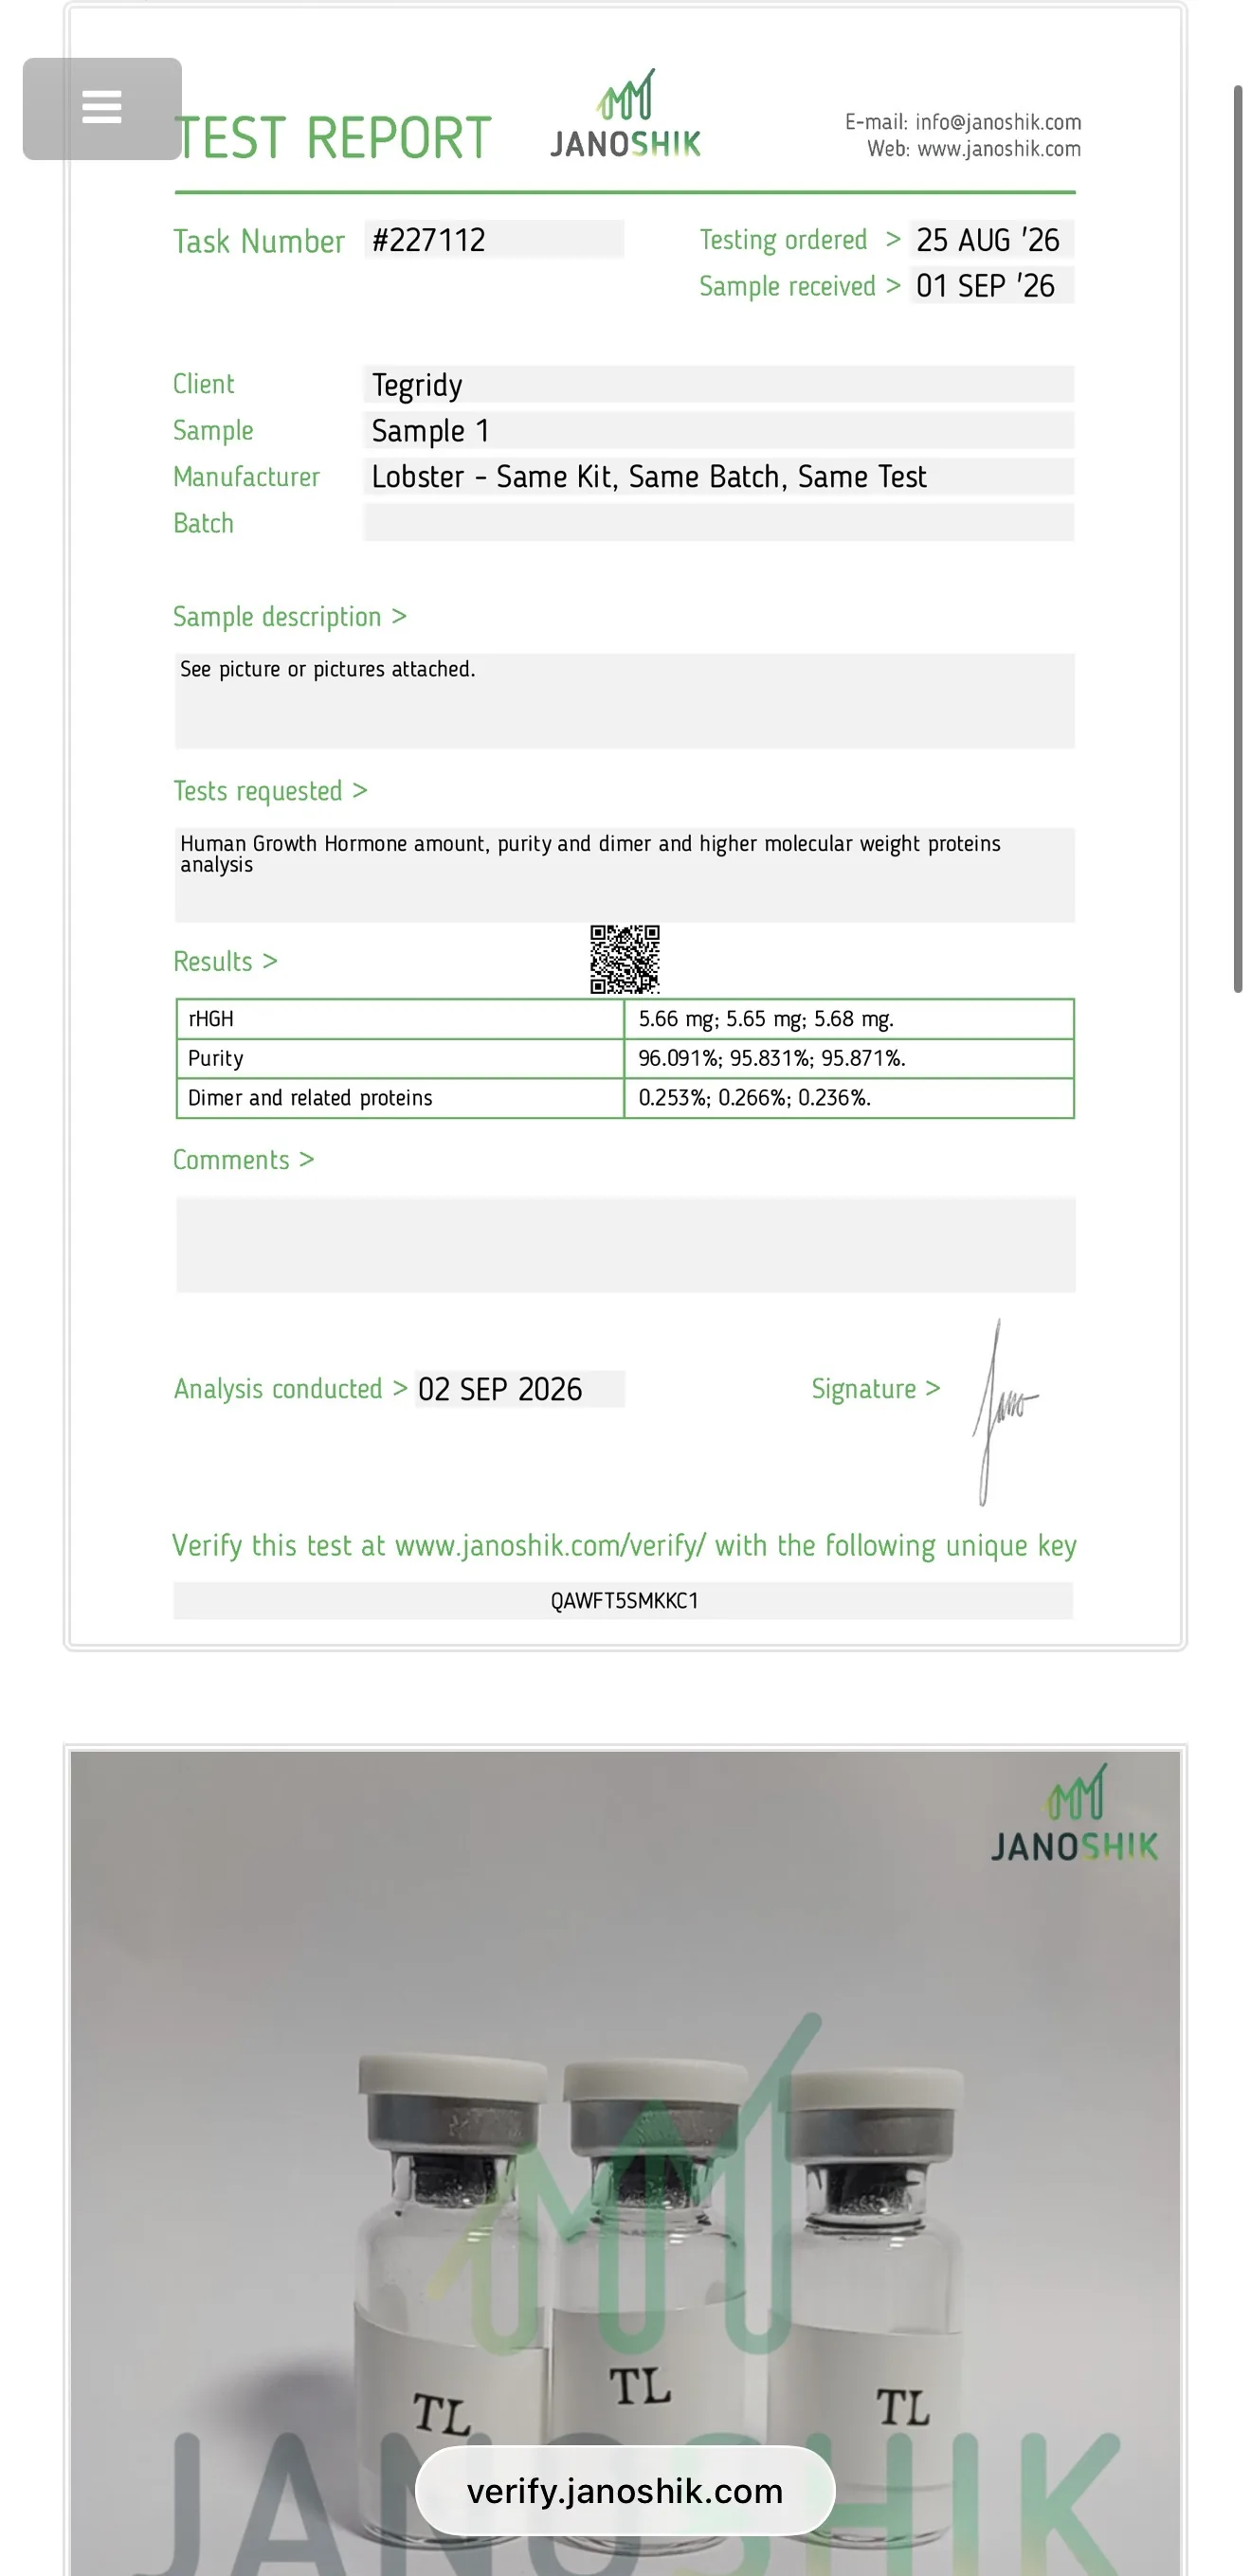
The August COA contains four measurements. Mean rHGH was 5.600 mg, mean purity 97.507%, and dimer and related proteins were not detected in all four. The September COA contains three measurements. Mean rHGH was 5.663 mg, mean purity 95.931%, and dimer averaged approximately 0.252%. So the discrepancy is real. Reported purity fell by roughly 1.6 percentage points, and dimer moved from not detected to around 0.25%.
But the measured HGH amount didn’t fall with it. Using roughly 3 IU per mg, both submissions remained around 17 IU.
There’s also an important limitation. These are different groups of vials, not the same vial measured twice, and there’s no independent vial-by-vial custody record linking both sets to one original kit. “Same exact kit” therefore remains Lobster’s reported provenance. There will also be differences in the storage and handling of the samples with the later samples having spent longer in storage and gone through another shipment. So Lobster has demonstrated a discrepancy, but he hasn’t demonstrated its cause.
The wider Lobster results make the story even stranger
Lobster also posted a series of other tests that he says belong to the same H240 and H150 production batches.
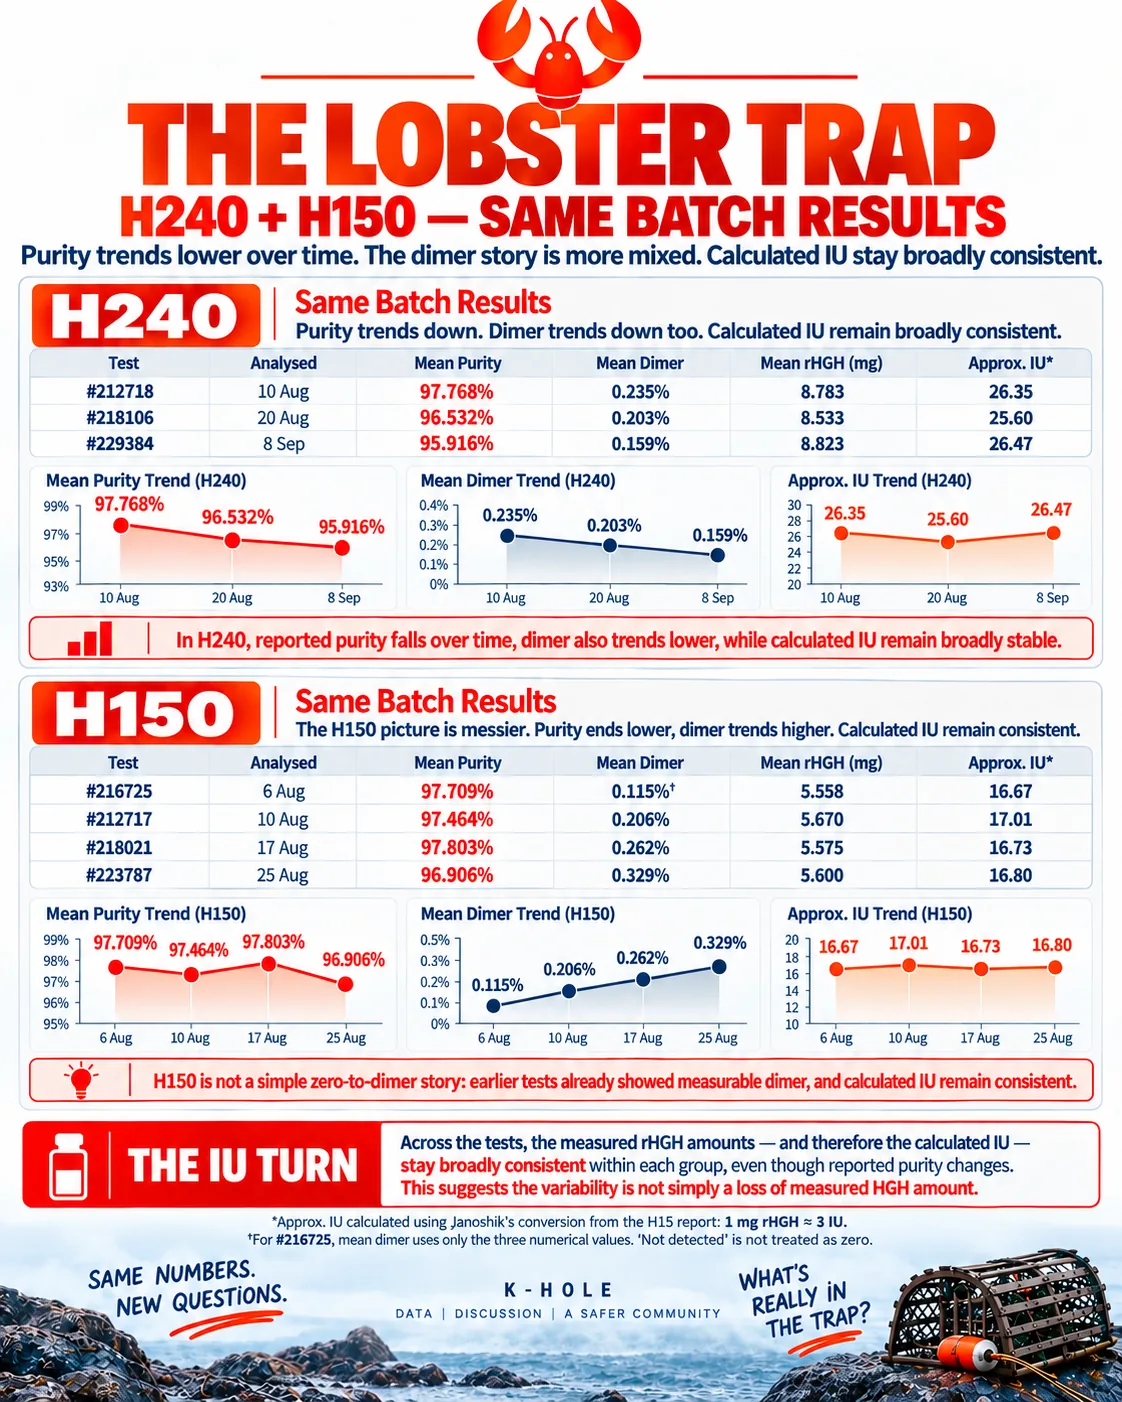
Across both groups, one thing stands out: measured HGH quantity stays broadly stable while reported purity changes. Dimer, however, doesn’t behave consistently between H240 and H150. That makes Lobster’s original description, it used to be 97 to 98% with no dimer and suddenly became 95 to 96% with dimer, too simple.
There is also a limit to how confidently the wider COAs can be treated as one longitudinal dataset. They don’t all carry the same manufacturing-batch identifier, so the grouping relies on Lobster’s production records rather than uniform batch information on the COAs themselves.
What Janoshik says is happening
Janoshik’s explanation wasn’t simply “lab variance”, nor was it simply “the HGH degraded.” Instead, he pointed to several possible contributors: time, vial-to-vial differences and analyst interpretation. Lobster’s questions also prompted Janoshik to revalidate his dimer method.
Sharp purity drops in the first weeks are not unusual
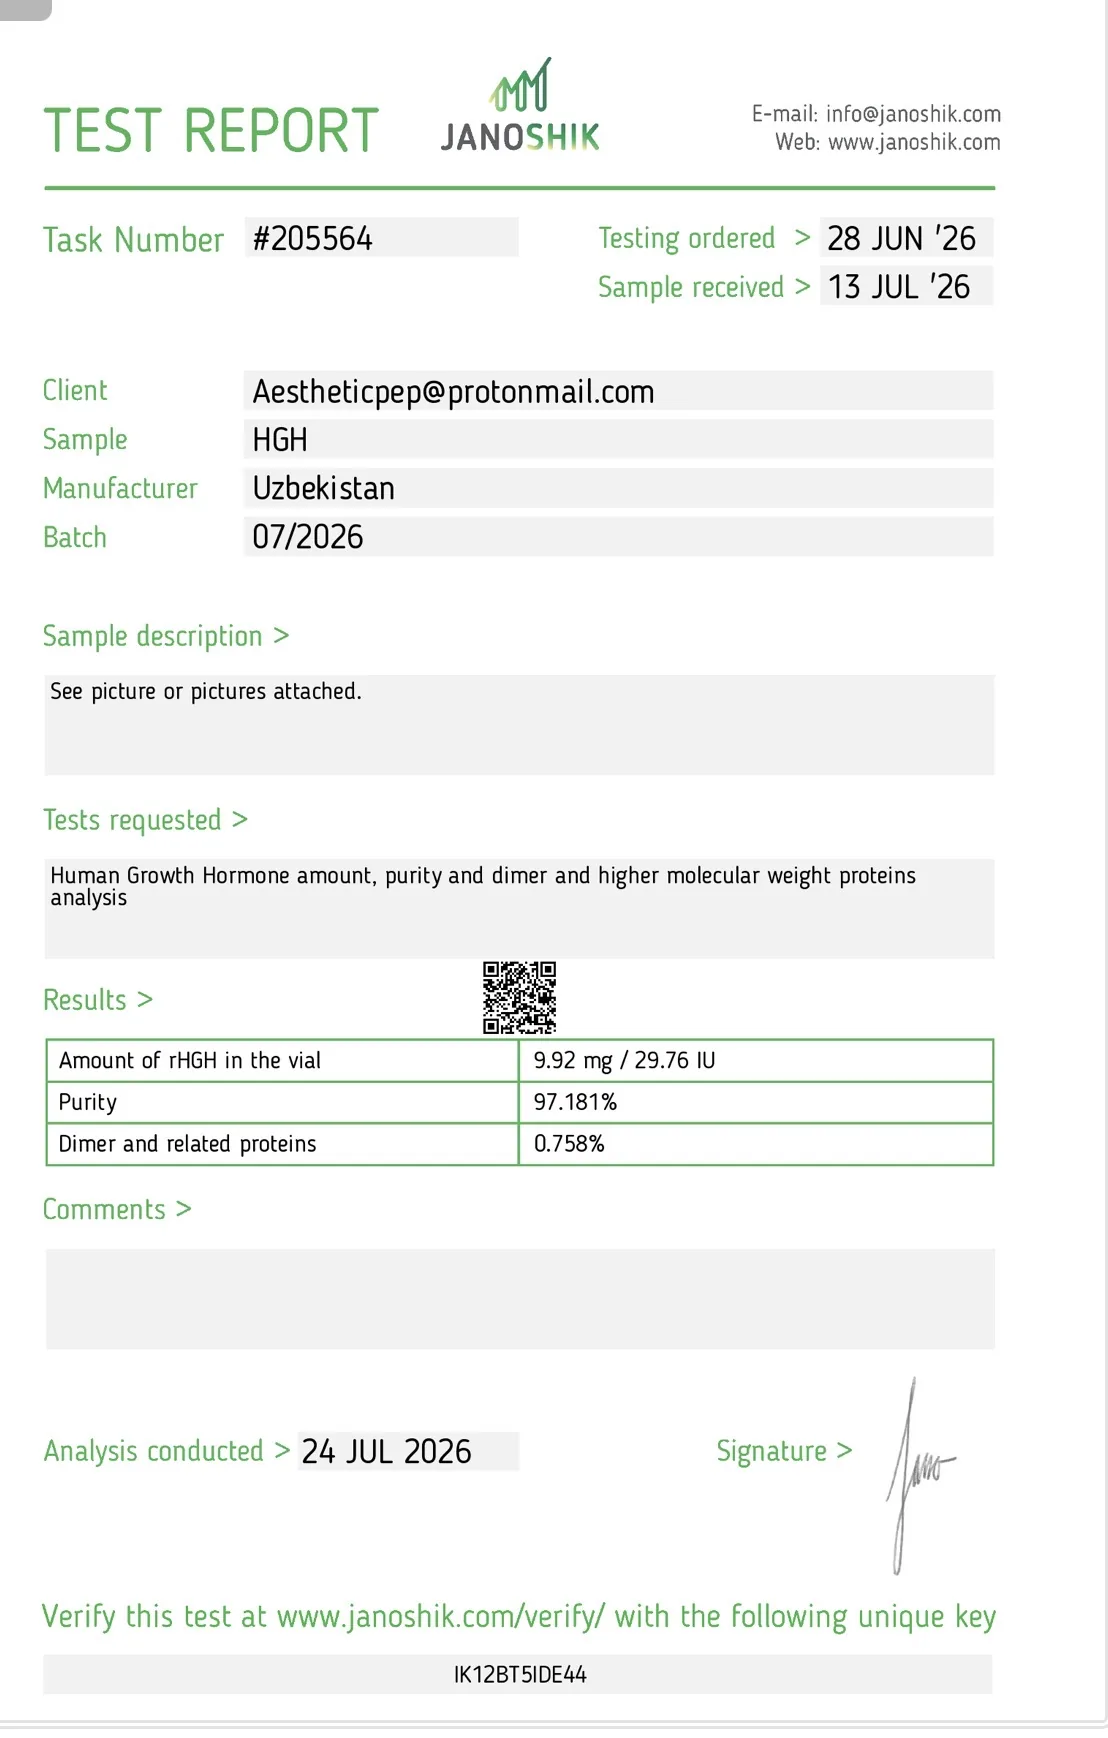
The HGH COA above was discussed with Janoshik. It shows 97.181% purity, 0.758% dimer and 29.76 IU, despite the HGH reportedly being more than four months old. That alone shows age does not produce the same purity result in every product. Janoshik said behaviour varies between products, but that he has repeatedly seen a relatively sharp fall in purity during roughly the first 1 to 12 weeks after manufacture. In other words, he is describing a pattern he has observed, not a rule that every HGH sample follows.
The cause is less certain. Residual oxygen and moisture were suggested as possibilities, but Janoshik was explicit that he does not know the exact mechanism with certainty.
He also produced the HGH stability graph below illustrating what he meant.
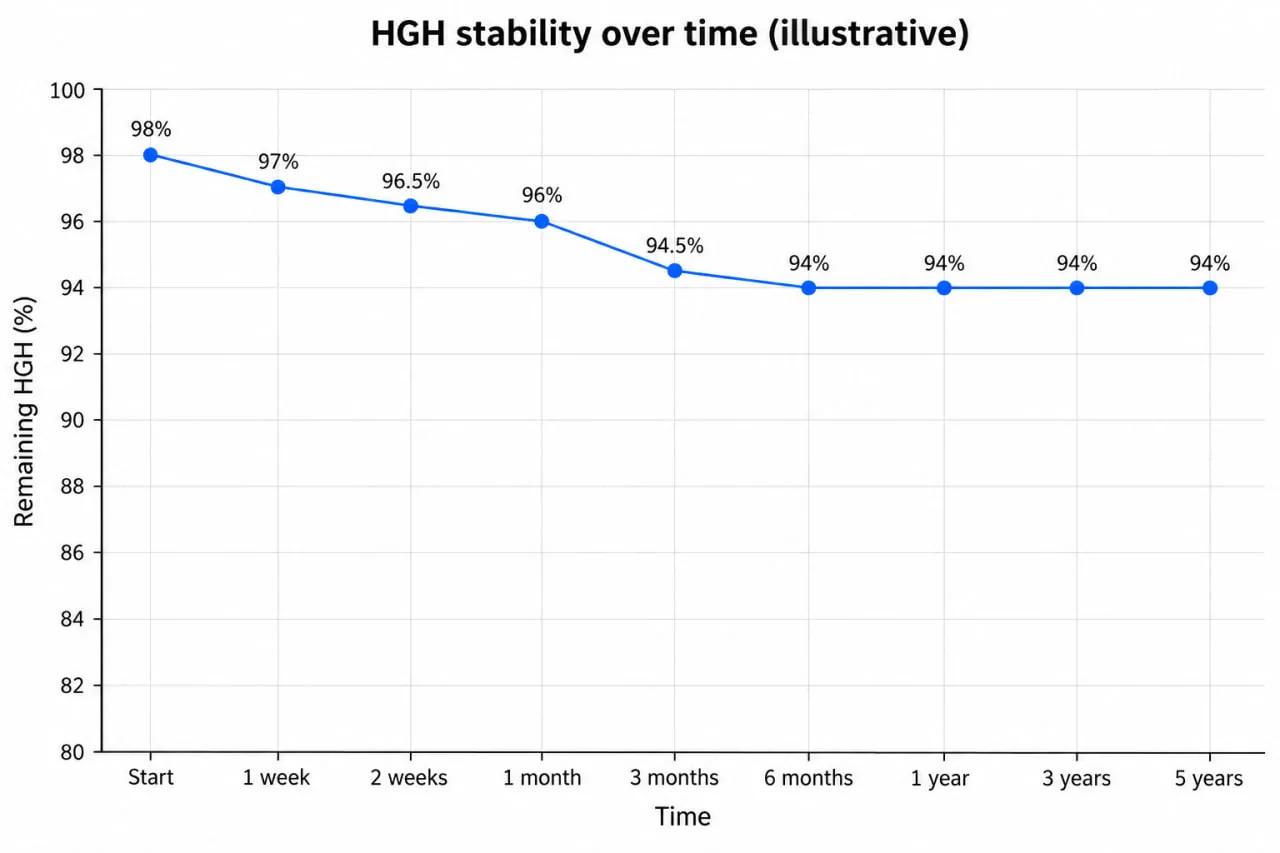
The graph shows an initially steep decline in purity followed by a much flatter period, effectively illustrating an early-drop-then-plateau pattern. Importantly, Janoshik labelled the graph “illustrative.” It’s not a longitudinal dataset produced by repeatedly testing one HGH batch, so the curve shouldn’t be read as a measured degradation rate or evidence that every batch will reach a particular purity at a particular week. What it does show very clearly is the pattern Janoshik says it has repeatedly observed in laboratory testing.
The graph changes the context of Lobster’s question. His assumption was essentially: Same batch = purity should stay the same. Janoshik’s experience suggests that assumption may itself be wrong. According to Janoshik, a newly manufactured HGH sample and samples from that same production run tested several weeks later can produce different purity profiles even without there having been a manufacturing change between them. And that makes the timing of Lobster’s results particularly interesting.
Another example: H240 shows the same downward purity pattern
The following COAs are from the H240 series.
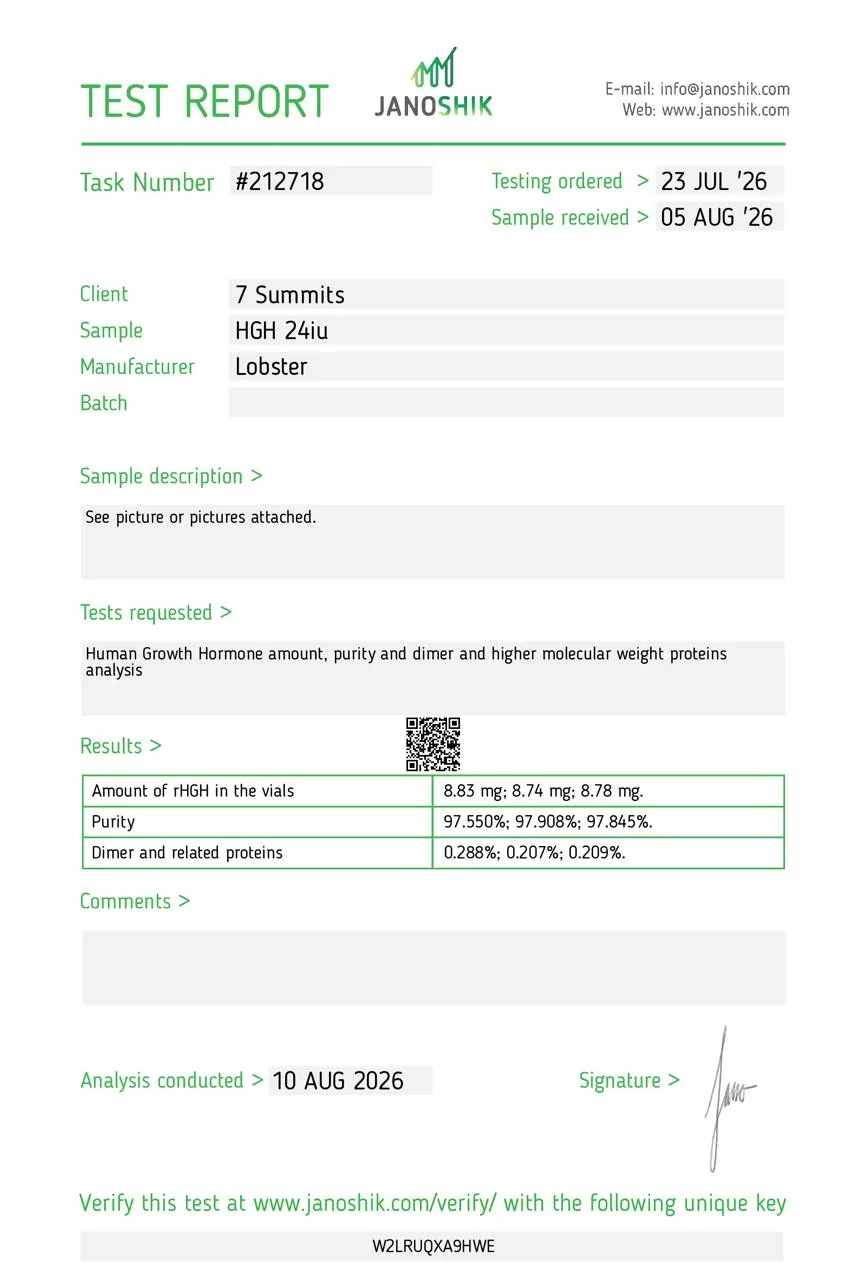
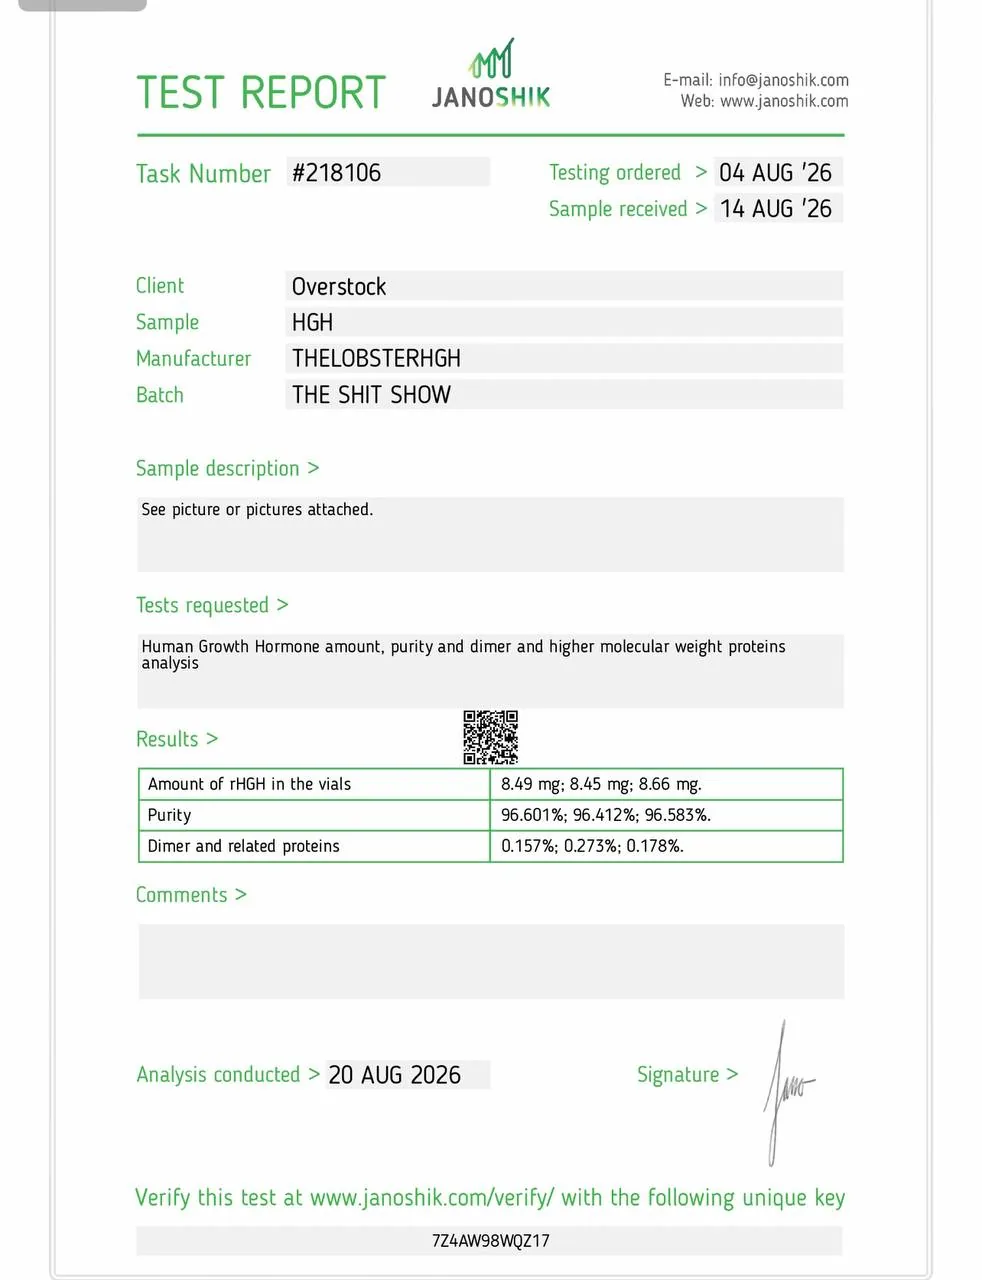
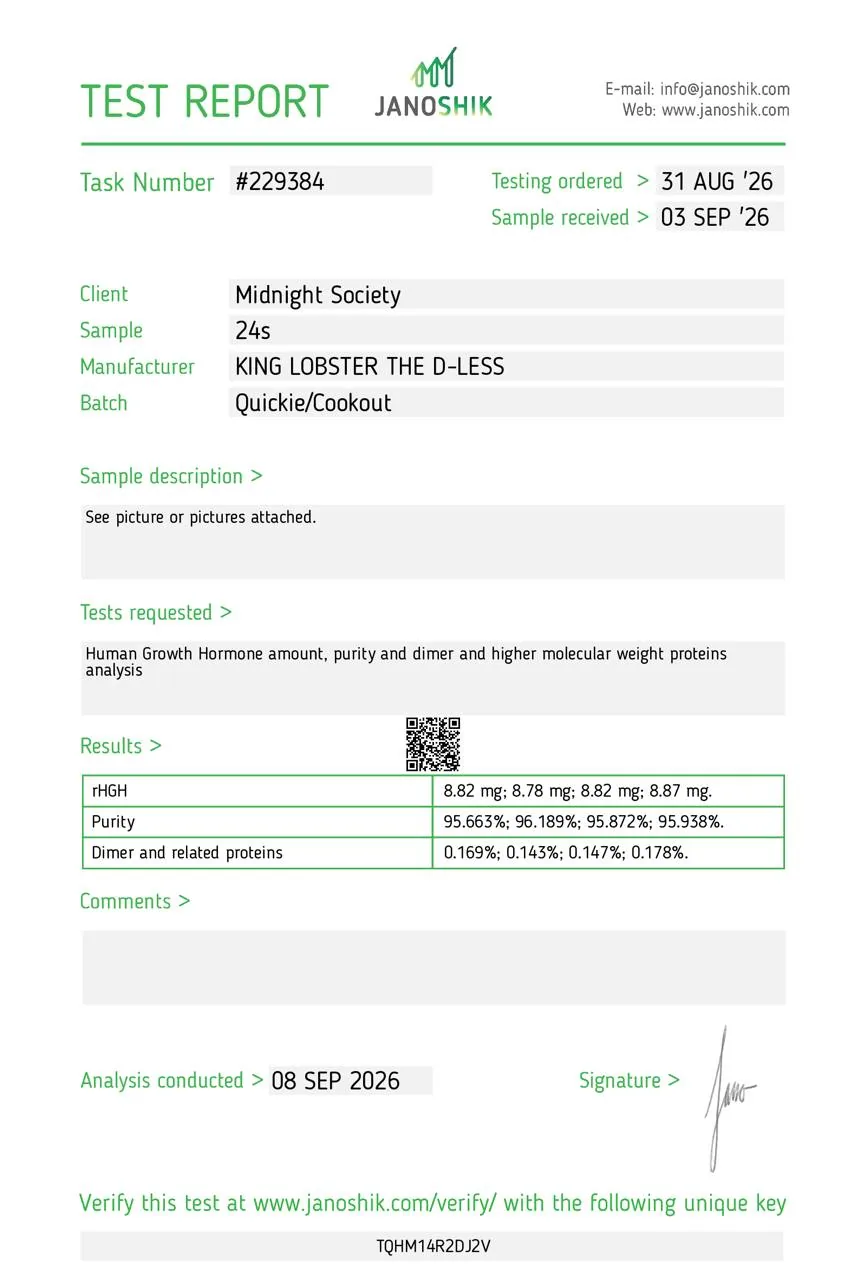
The H240 reports were analysed on 10 August, 20 August and 8 September, with mean purity moving: 97.768% → 96.532% → 95.916%.
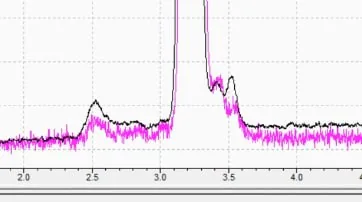
Janoshik reviewed those results and said he could see higher impurities in the later samples and was confident in the measurements. The middle result also sits between the earlier and later purity values. That sequence looks strikingly similar to the type of early decline represented in Janoshik’s earlier graph.
He also described an older example 3 years ago, involving QSC tesamorelin that reportedly tested around 99% purity, fell to around 97% two weeks later, and then remained around that level for approximately two years. Janoshik said he’s seen this kind of early purity chsnge repeatedly. That makes the timing of Lobster’s tests considerably more relevant than it first appeared.
The analytical side: vial differences and interpretation
Time, however, wasn’t Janoshik’s only explanation. Janoshik said the variation could also reflect a combination of differences between individual vials and analyst evaluation. Even samples from the same production batch aren’t necessarily analytically identical from vial to vial, while interpretation of the chromatographic data can introduce another layer of variation.
Chromate: three ways the purity result can move
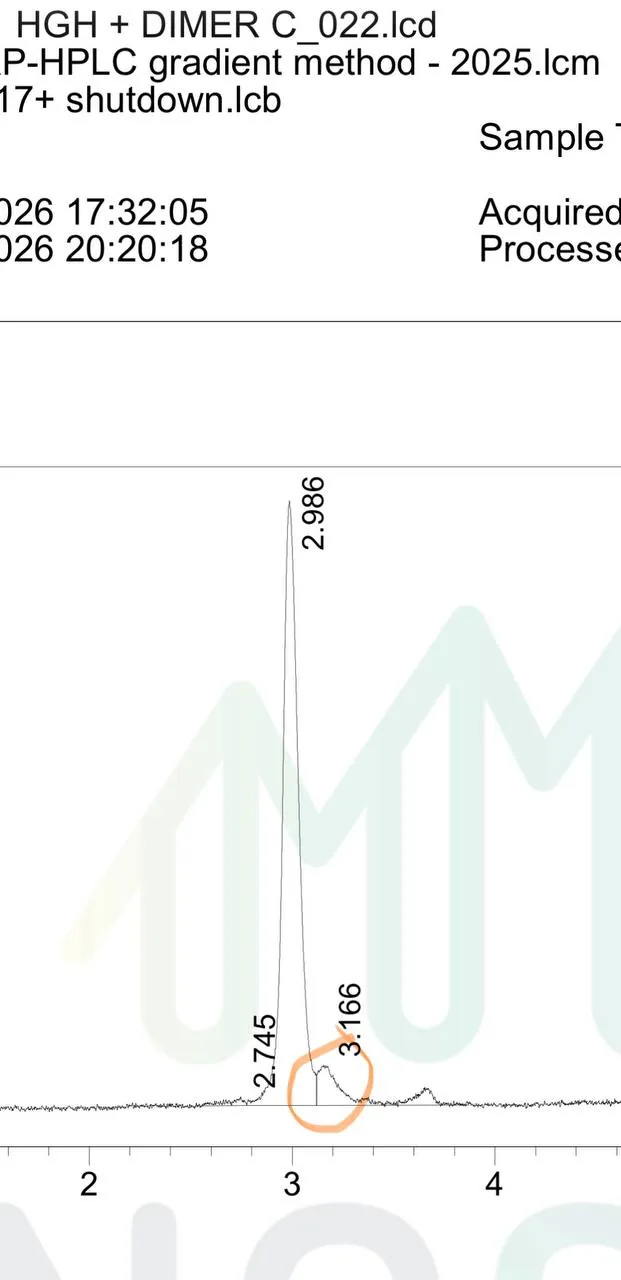
Chromate had independently raised much the same issue while looking at the chromatography. He highlighted the small shoulder sitting beside the main HGH peak and gave three possible explanations, in order of likelihood: variation in peak integration, variation in impurity resolution, and genuine degradation of the sample over time.
Variance in peak integration; Chromate said that a few pixels difference can have a big effect. Different analysts can be more or less generous in their interpretation and automated integration could be affected by noise etc...
Variance in impurity resolution; He considers this especially problematic if the method produces close-eluting shoulders; from day-to-day and run-to-run, the same shoulder can be more or less resolved, shifting the purity.
That doesn’t mean the lab can arbitrarily turn 98% into 95%. It means the number on the COA reflects both the sample being tested and the analytical process used to measure it.
Importantly, Chromate also included actual degradation over time as one of the possibilities. So the analytical and time explanations are not mutually exclusive. The product itself may change while measurement and interpretation contribute additional variation
How much variation can the method itself produce?
Once analyst judgement and peak integration enter the picture, there’s an obvious question: how much variation should Janoshik’s purity method normally produce when essentially the same batch is tested again?
When Janoshik was asked whether he would consider publishing measurement uncertainty on his COAs, he said he was disinclined to, adding that he thought it would be useful to only around 10 to 20% of clients. That doesn’t mean the method has no uncertainty, it means that uncertainty isn’t currently expressed on the COA in a way that allows customers to put a result such as 95.9% versus 97.5% into statistical context.
For Lobster’s comparison, that information would be particularly useful. The difference between the two mean purity results is about 1.6 percentage points. If vial variation, integration and analyst interpretation can all move the reported figure, the important question is: How much of that 1.6-point difference is greater than the variation Janoshik would normally expect from its own purity method? Without repeatability or uncertainty data for that specific analysis, we can’t answer that from the COAs alone.
The dimer problem isn’t straightforward either
The dimer results introduce another complication. Janoshik said expected variation in his dimer analysis had been reduced to around 0.1% absolute or 10% relative, whichever is larger. More importantly, Lobster’s questions prompted Janoshik to revalidate and improve the lab’s dimer method. Janoshik explained that samples containing around 0.05 to 0.08% dimer might previously have appeared as zero, whereas the improved method could detect those low levels more readily.
That changes how the older “not detected” results should be interpreted. It doesn’t necessarily mean literally no dimer was present; it means none was reported above the detection or reporting capability being applied at the time. Janoshik also said that, generally, falling purity tends to be accompanied by increasing dimer. H150 broadly fits that pattern. H240 does not: its mean purity falls from 97.768% to 95.916%, while reported dimer falls as well. So dimer can’t be treated as a simple marker that must rise whenever purity falls. Genuine changes in the material, vial-to-vial differences and analytical variation may all be contributing. And because the dimer method was revalidated during this period, one important question remains:
When did the improved method come into use, and which Lobster COAs were tested before and after the change?
Until that is known, the dimer results should not automatically be treated as though they were all generated under identical analytical conditions.
What about the famous ten-year-old garage HGH?
The discussion inevitably returned to the old story that HGH had supposedly sat in a garage for years and later tested with surprisingly little degradation. People asked Janoshik what that old sample had actually tested at and whether the implication was that HGH falls rapidly during the first 12 weeks and then remains relatively stable. Janoshik remembered the case but said he couldn’t remember the exact result. He also declined to give a firm answer about the underlying stabilization mechanism. So the garage story should stay exactly where it belongs for now: an interesting anecdote, not evidence for this case.
What Lobster actually demonstrated
Lobster did show a real discrepancy. A later submission reportedly taken from the same exact kit returned: almost unchanged HGH quantity, lower reported purity and measurable dimer where the earlier report had returned non-detect. What he didn’t establish is a single cause. The evidence now points to several plausible contributors: time, vial-to-vial variation, analyst interpretation, peak integration and resolution, and changes in the sensitivity of the dimer method.
One finding remains particularly striking throughout the wider dataset: measured HGH quantity stays broadly stable even while the purity profile changes.
So this isn’t really a story about HGH disappearing from the vial. It’s a story about how the reported quality profile can change over time, between vials and through the analytical process itself.
So did Lobster catch Janoshik in the trap?
Not exactly. What he did was expose why the assumption behind the trap was too simple. Janoshik says he’s repeatedly observed sharp purity changes during roughly the first 1 to 12 weeks, while also acknowledging that vial differences and analyst interpretation can affect the result. Lobster’s questions also prompted the laboratory to revalidate and improve its dimer method.
None of that gives us one neat culprit for the H150 difference. But it does give us a much better explanation for why: same kit does not necessarily mean same COA.
The discrepancy may reflect some combination of time, vial variation, analyst interpretation and method. And that is probably the clearest lesson from the whole investigation:
A COA is a measurement of a particular sample, at a particular moment, under a particular analytical method. It’s not an immutable fingerprint of that product forever.
Comments