
If you spend any time looking at certificates of analysis for peptides, the idea of “purity” feels straightforward. A chromatogram shows a main peak, a few smaller peaks, and the lab reports a number: 98%, 99%, sometimes even higher. Buyers have become used to reading those numbers as a simple measure of quality.
But when it comes to NAD⁺, that familiar logic begins to fall apart.
What I’ve noticed is that some laboratories report a purity percentage, usually 99% or higher, while others simply report the measured mass of NAD in the vial. In this article I’ll break down why that reporting variation exists and take a closer look at several NAD certificates of analysis.
This discrepancy has already been debated many times, and the usual explanation is simply that NAD is not a peptide and therefore cannot always be tested using peptide style purity methods.
That explanation is technically true, but it only scratches the surface.
The problem is not that purity itself should be subjective or open to interpretation. In a rigorous assay, degradation products and related species are impurities and should be treated as such. The real problem is that not all laboratories are measuring NAD with methods capable of distinguishing intact NAD from the compounds it degrades into.
The reason lies in the chemistry of the molecule itself.
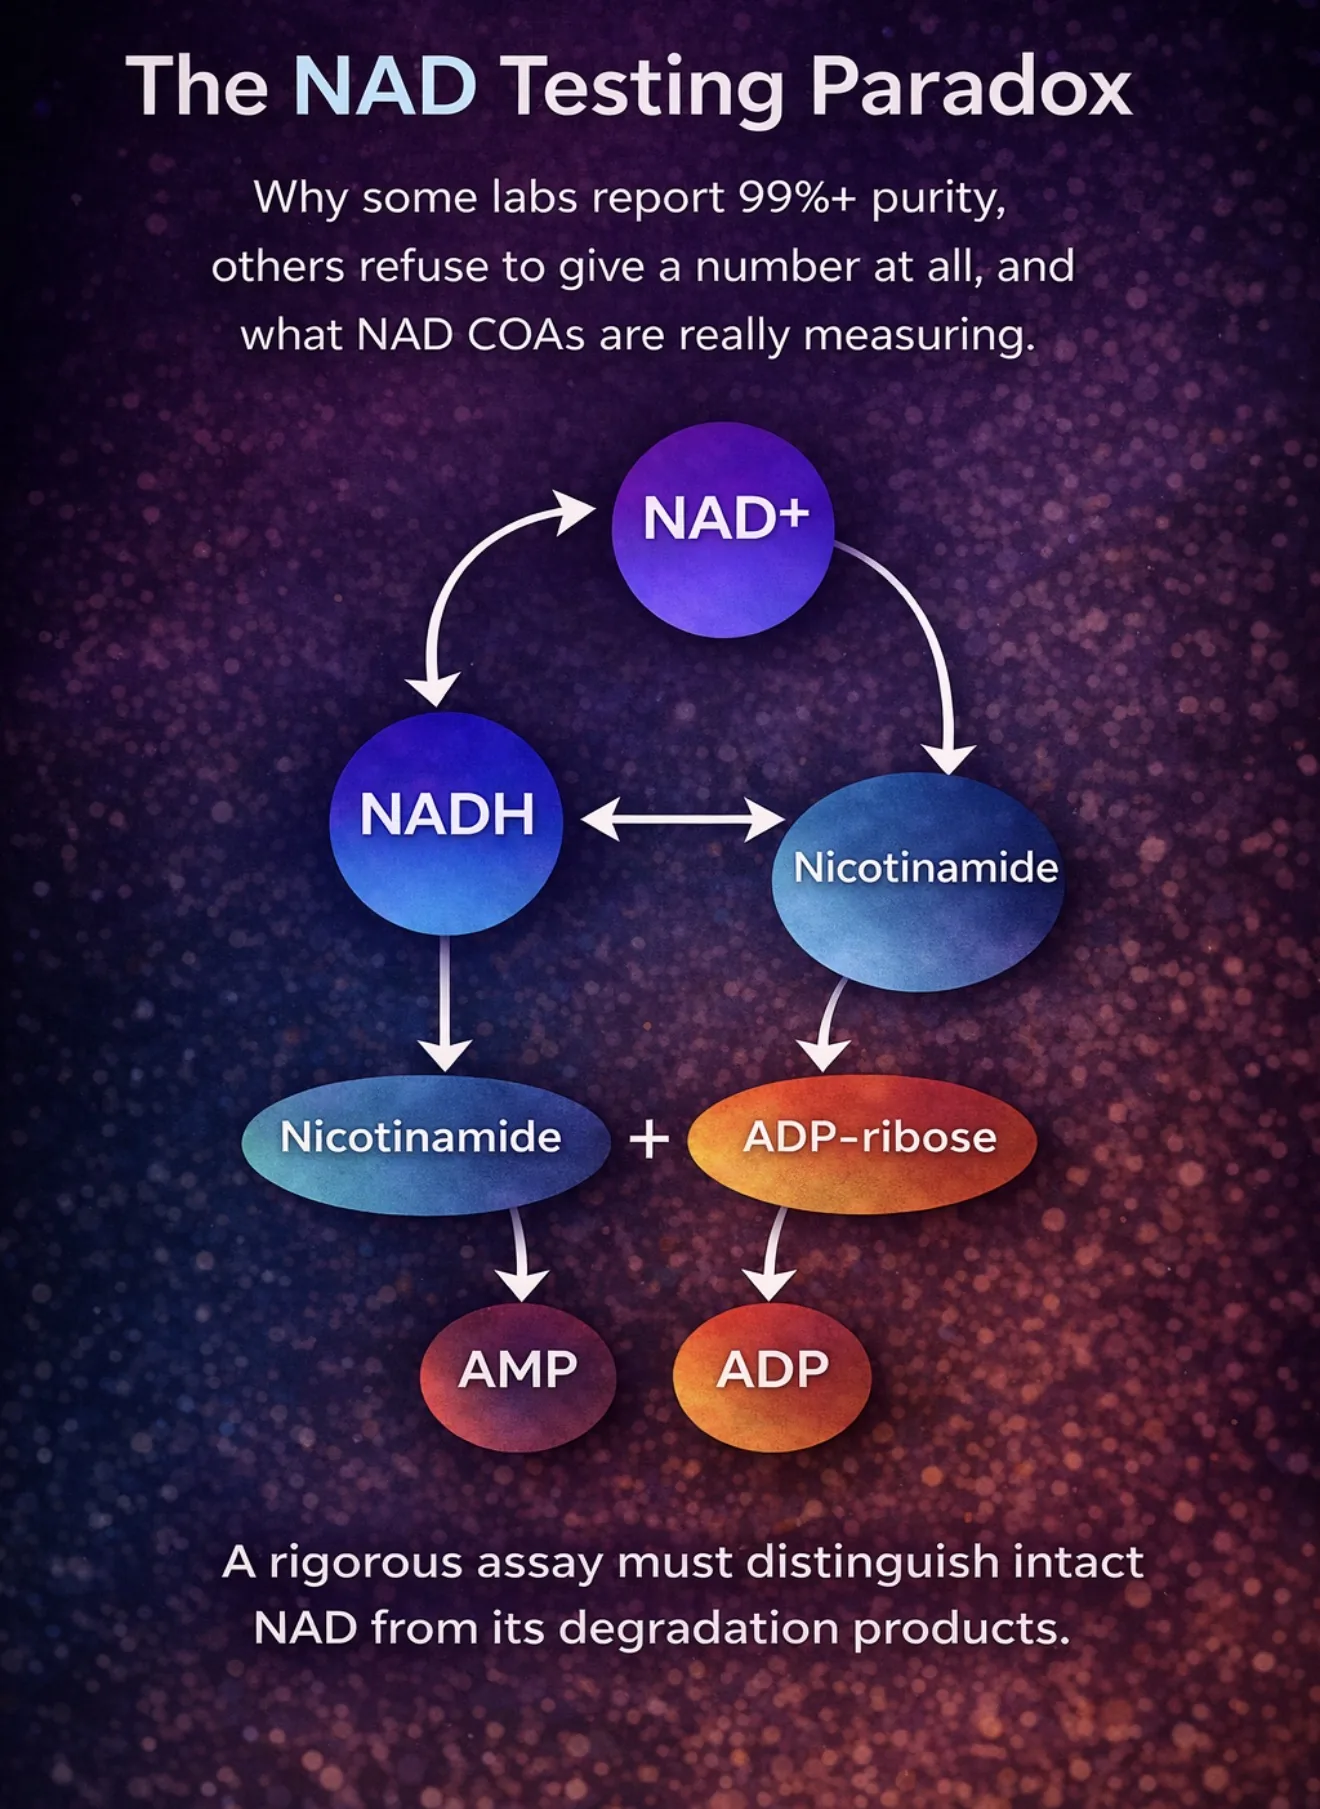
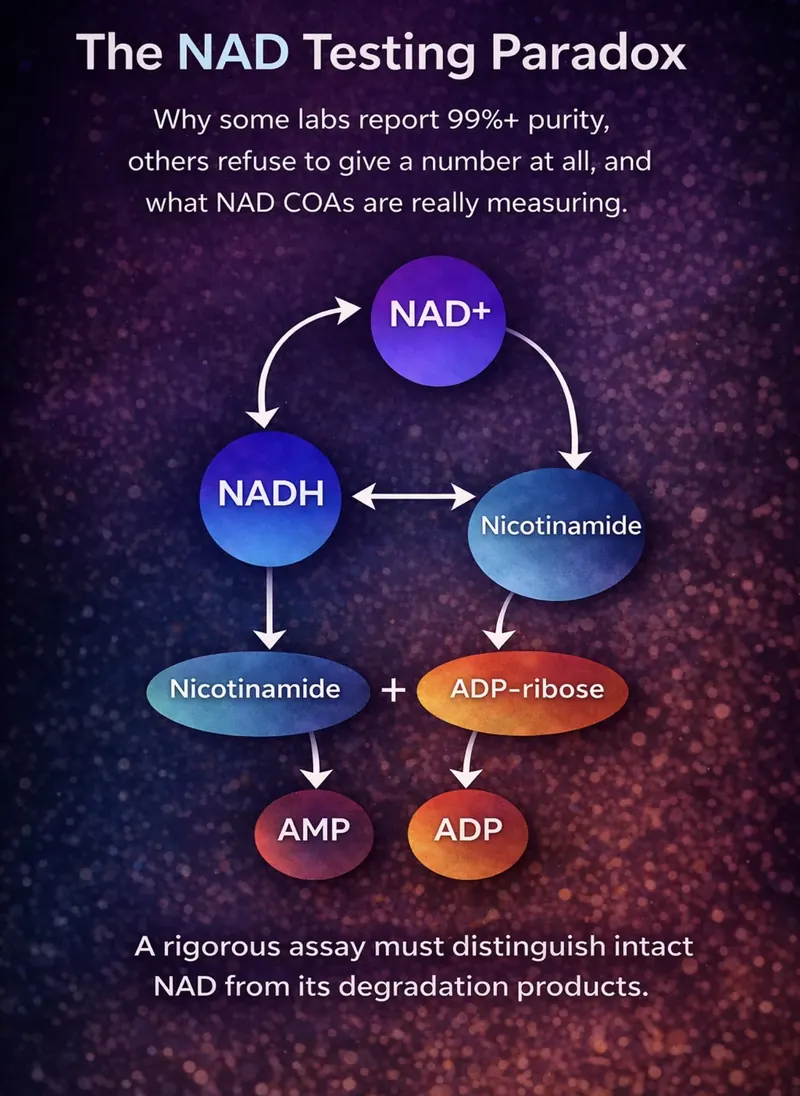
Unlike most peptides, NAD⁺ does not exist as a single isolated compound under typical analytical conditions. It belongs to a family of closely related molecules that naturally interconvert and degrade into one another. During storage, preparation, or analysis, NAD can break down into compounds such as:
Nicotinamide
ADP-ribose
AMP
ADP
NADH (the reduced form of NAD)
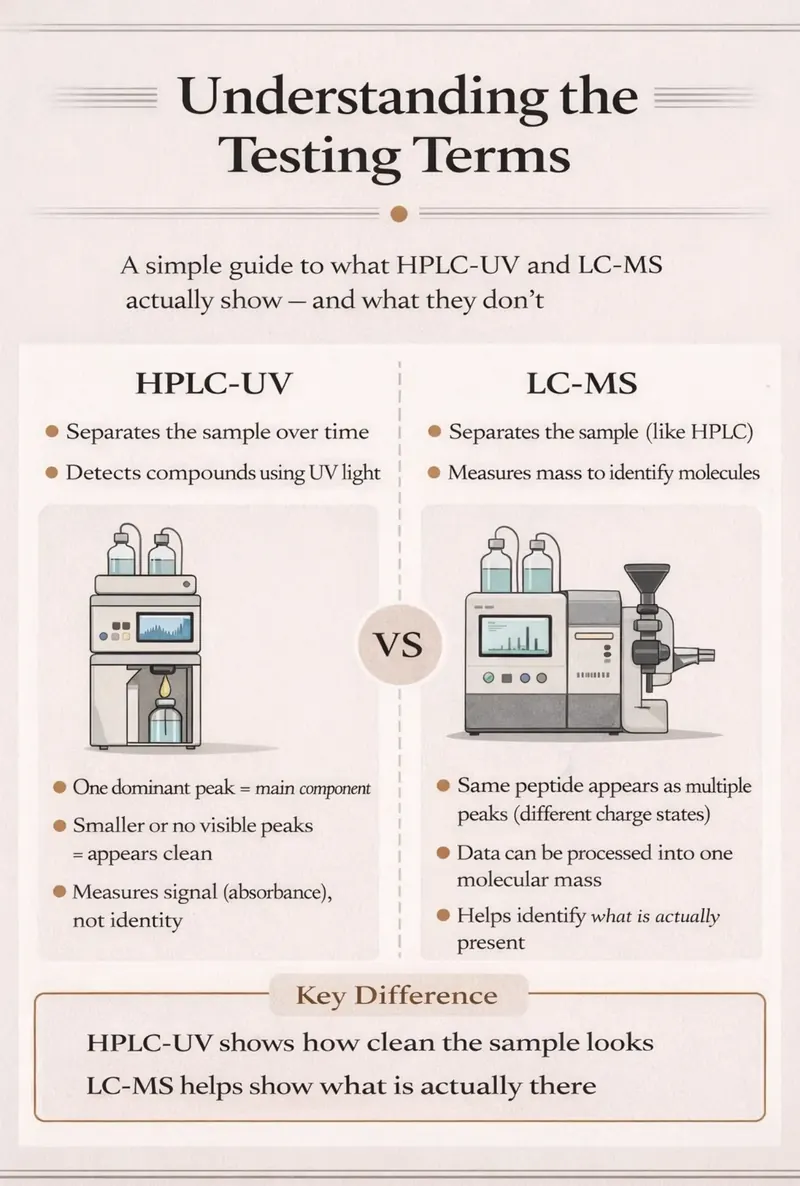
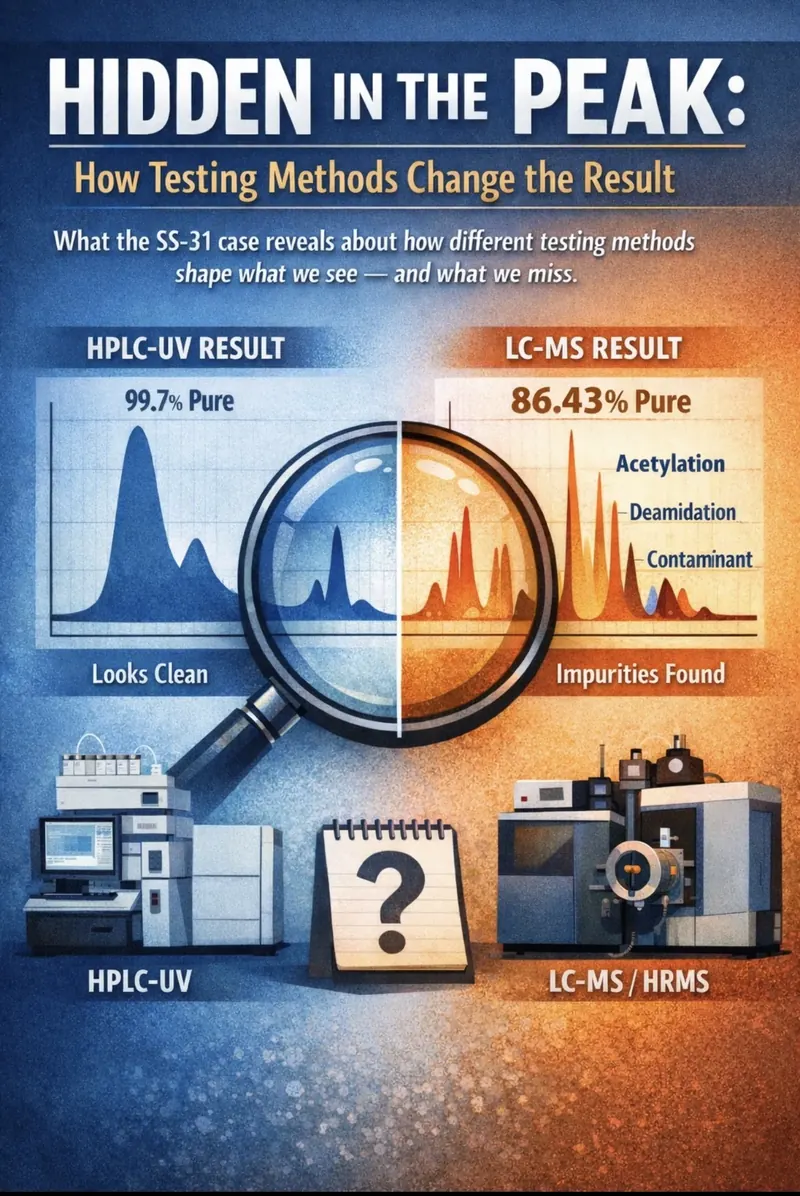
Many of these molecules share similar UV absorption properties and chromatographic behaviour. In practical terms, this means that a simple HPLC test, particularly one designed for peptides, may detect a large peak and label it “NAD” without actually proving that it is.
That is how two laboratories can look at the same vial and arrive at very different conclusions.
One lab may simply measure the largest UV-absorbing peak and report “99.8% purity.”
Another lab may try to confirm the molecule’s identity using mass spectrometry or NMR and discover that the peak is not NAD at all.
Neither laboratory is necessarily acting in bad faith. But they may be measuring different things, or using methods with very different levels of selectivity. And that distinction matters enormously, because purity should not depend on interpretation. If a compound is not intact NAD, it should not be counted as functional NAD in a rigorous purity assay.
And that distinction matters far more than the percentage printed on the certificate.
Because when it comes to NAD testing, the real question is not:
“What is the purity number?”
The real question is:
What exactly is the laboratory measuring when it says “purity”?
Why Peptide Testing Methods Often Fail for NAD
One of the biggest sources of confusion around NAD testing comes from the fact that many laboratories analyse it using methods originally designed for peptides.
At first glance this seems reasonable. Reverse phase HPLC is widely used in peptide analysis and produces the familiar chromatograms buyers have become used to seeing: one dominant peak, a few smaller peaks, and a reported purity based on peak area.
But NAD is not a peptide.
And when peptide style methods are applied to it, the results can become misleading very quickly.
A good example appeared in a recent certificate of analysis I reviewed ( see case 1 below).
The laboratory reported 99.956% NAD purity using reverse phase HPLC. On paper that looks impressive. The chromatogram showed a single dominant peak accounting for almost the entire signal, with only tiny impurity peaks.
However, the detection wavelength used in the analysis was 214 nm.
That detail may seem minor, but it is actually critical.
214 nm is commonly used in peptide analysis because peptide bonds absorb strongly at that wavelength. The technique is extremely sensitive for molecules built from amino acids.
NAD, however, is not built from peptide bonds. It is a nucleotide cofactor, and like other adenine containing nucleotides it shows strong ultraviolet absorbance around 260 nm.
That difference matters because many molecules, including buffers, solvents and unrelated compounds, can absorb at 214 nm.
As a result, the signal at that wavelength is far less specific for NAD.
In practical terms, a large peak detected at 214 nm does not necessarily prove the compound is NAD. It only proves that something in the sample absorbs UV light at that wavelength.
To make matters more complicated, NAD is chemically unstable compared with most peptides. Its central phosphodiester bond can break down over time, producing a family of related molecules such as nicotinamide, ADP-ribose, AMP and ADP. These degradation products are not contaminants in the usual sense, they are simply part of the normal chemical lifecycle of the molecule.
A well designed NAD analytical method typically reveals this family of related species as smaller peaks in the chromatogram.
That is why extremely high reported purities can sometimes raise suspicion rather than confidence. If a chromatogram shows almost nothing except a single perfect peak, it may indicate that the analytical method is not detecting the expected degradation products at all.
In other words, the result may be telling us more about the limitations of the method than about the purity of the molecule.
This is one of the main reasons some laboratories decline to report a simple purity percentage for finished NAD products. Instead, they focus on confirming the molecule’s identity and measuring how much NAD is present, rather than forcing the result into the same framework used for peptides.
Why These Molecules Exist: A Brief Look at the NAD Pathway
Part of the reason NAD analysis is complicated is that NAD is not just a chemical compound, it is a central metabolic cofactor used throughout living cells.
Inside the body, NAD participates in hundreds of biochemical reactions, particularly those involved in energy metabolism. During these reactions, NAD constantly cycles between two forms:
NAD⁺ ⇄ NADH
The oxidised form (NAD⁺) accepts electrons during metabolic reactions, becoming NADH. NADH can then donate those electrons in processes such as oxidative phosphorylation, converting back into NAD⁺.
In addition to this redox cycling, NAD is continuously broken down and recycled through several metabolic pathways. Enzymes such as CD38, PARPs and sirtuins consume NAD and generate smaller molecules including:
Nicotinamide
ADP-ribose
cyclic ADP-ribose
These compounds can then be converted back into NAD through salvage pathways.
Because NAD naturally exists within this dynamic biochemical network, it is rarely encountered as a completely isolated molecule for long periods of time. Even outside the body, the same chemical tendencies toward degradation and interconversion can produce related compounds that appear in analytical testing.
This is why NAD chromatograms often show a family of related molecules rather than a single perfectly clean peak.
How Labs Actually Confirm NAD Identity
If a single HPLC peak is not enough to prove something is NAD, the obvious question becomes:
How do laboratories confirm that a compound really is NAD?
Reliable NAD testing rarely relies on just one analytical technique. Instead, laboratories typically combine several complementary approaches that answer two separate questions:
1. Is the molecule actually NAD?
2. How much NAD is present in the sample?
These may sound like the same thing, but analytically they are very different problems.
UV Spectroscopy
The simplest way to detect NAD is through its UV absorbance.
NAD⁺ contains an adenine ring that absorbs strongly at 260 nm, which is why nucleotide analysis commonly uses that wavelength.
However, NAD also has another useful property. When NAD⁺ is reduced to NADH, it produces a distinctive signal at 340 nm.
This property has been used for decades in metabolic assays that track NAD/NADH reactions.
But UV detection alone still has limitations. Several molecules in the NAD degradation pathway also absorb around 260 nm, meaning UV signals cannot always distinguish between closely related compounds.
That is why other techniques are often required.
LC-MS
One of the most reliable methods for confirming NAD identity is liquid chromatography coupled with mass spectrometry (LC-MS).
Here, chromatography separates compounds and the mass spectrometer measures their molecular mass.
For NAD⁺ the expected mass is approximately 663 Da. Mass spectrometry can confirm this mass and often detect characteristic fragmentation patterns.
This dramatically reduces the risk of misidentifying a compound that simply produces a similar chromatographic peak.
NMR
Another technique used in NAD analysis is nuclear magnetic resonance (NMR) spectroscopy.
Unlike chromatography, NMR identifies molecules based on their atomic structure. Each atom produces characteristic signals depending on its chemical environment.
For NAD, this includes signals from:
the adenine ring
the nicotinamide group
the ribose sugars
the phosphodiester linkage
NMR can therefore provide extremely strong structural confirmation that a compound is truly NAD.
However, NMR is less sensitive for detecting trace impurities, which is why it is usually used alongside other techniques rather than alone.
Profiling the NAD “Family”
A well designed NAD analytical method does more than just confirm the main compound.
It also checks for the related molecules that appear when NAD degrades.
Common members of this family include:
NADH
Nicotinamide
ADP-ribose
AMP
ADP
By establishing where these compounds appear in a chromatogram, analysts can build a retention-time map of the NAD family. Unknown samples can then be compared against this map.
This kind of method validation is often referred to as selectivity, the ability of the analytical method to distinguish between closely related molecules.
When done properly, the result is not simply a purity number but a chemical profile showing how the sample relates to the wider NAD family.
Case 1: When a “99.9% NAD” Certificate Raises Questions
After reviewing several NAD certificates of analysis, one pattern begins to appear repeatedly: laboratories reporting extremely high purities using peptide style analytical methods.
A good example comes from a certificate issued by Freedom Diagnostics, which reports 99.956% NAD⁺ purity for a 1000 mg vial.
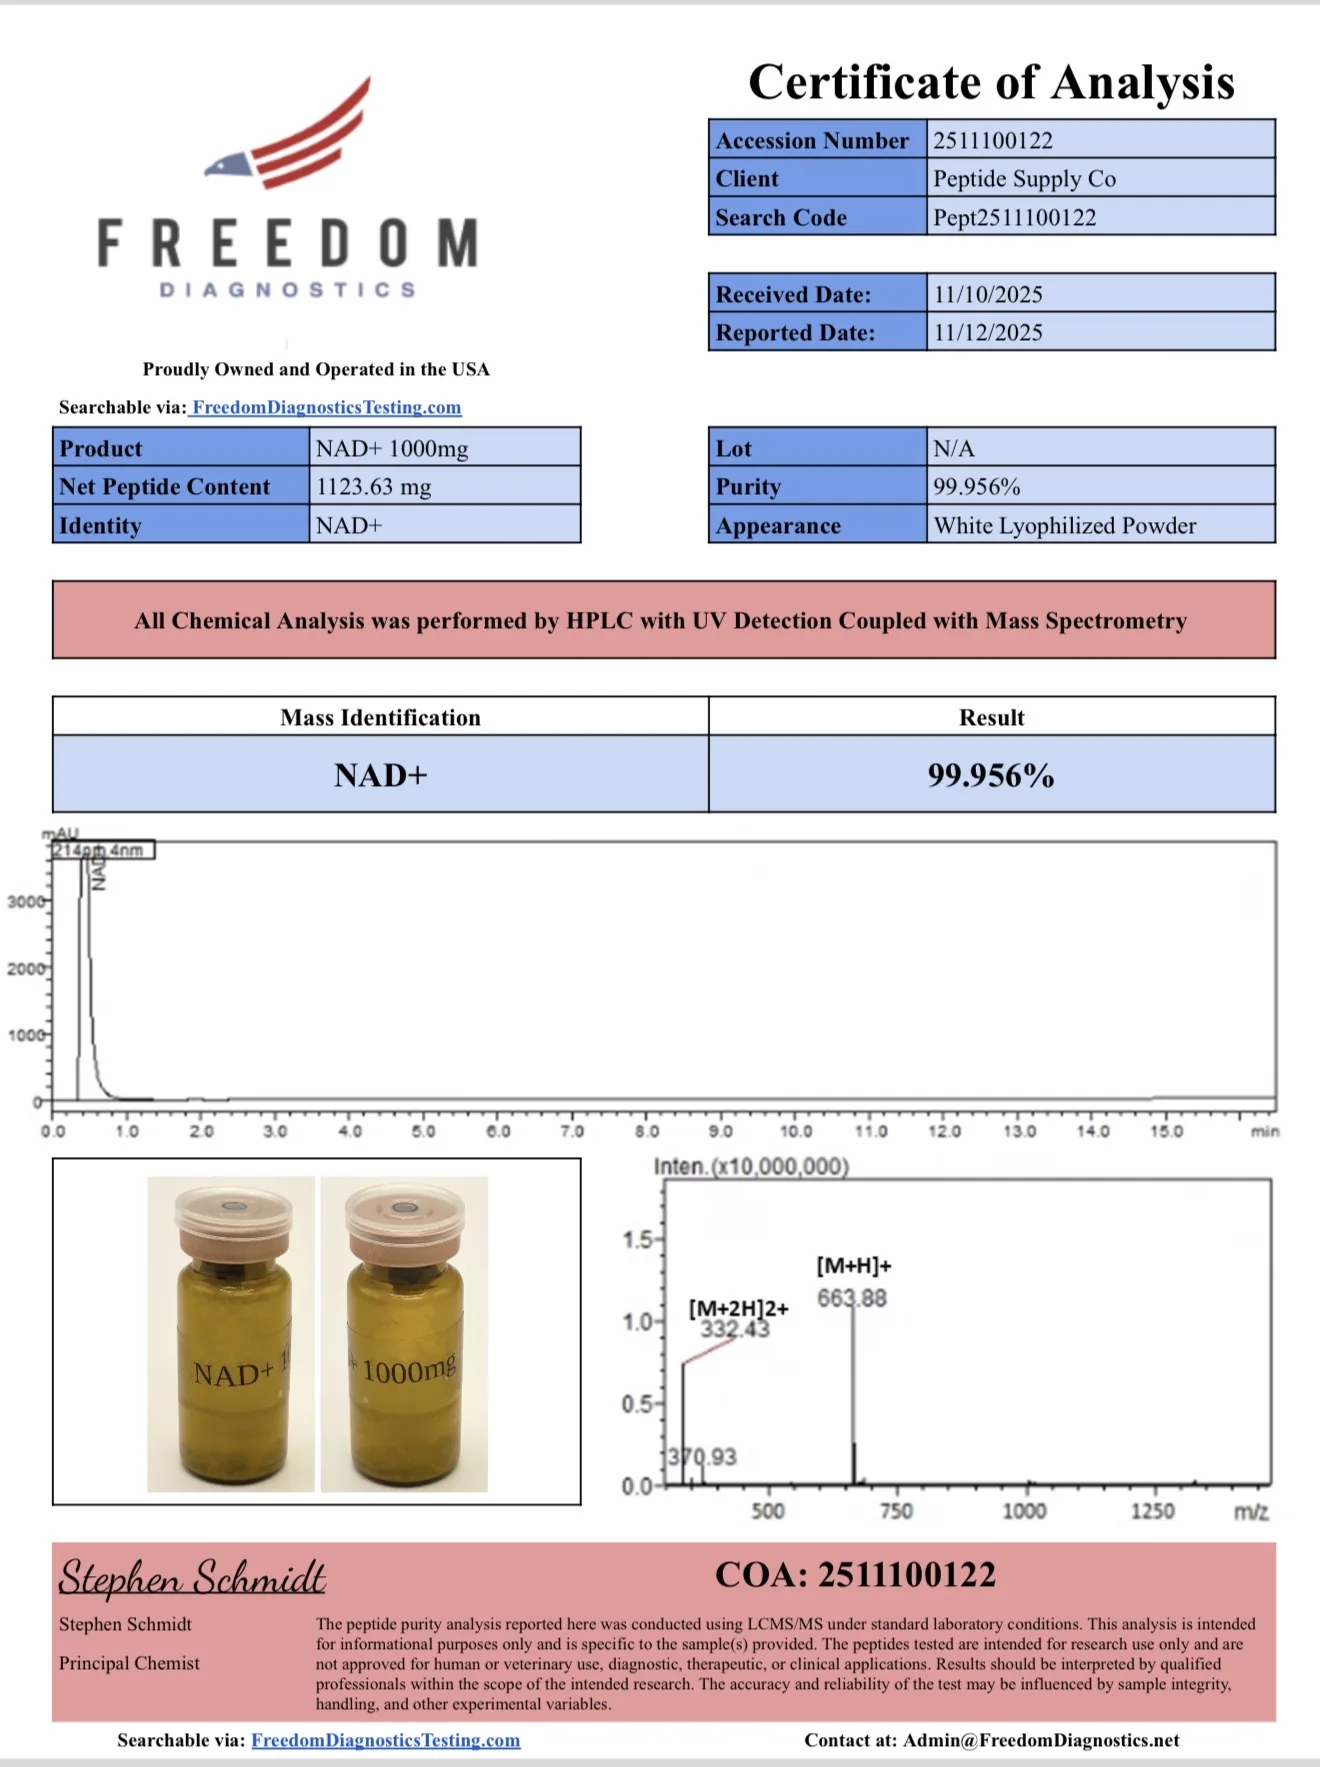
At first glance the report looks reassuring. It includes a chromatogram, a mass spectrum and a very high purity value.
But closer examination raises several questions.
A Peptide Testing Template
Multiple parts of the report refer to the compound as a peptide.
NAD⁺ is not a peptide. It is a nucleotide cofactor.
This suggests that the laboratory may be using a peptide reporting template, rather than a method designed specifically for nucleotides.
Detection at 214 nm
The report states that detection was performed at 214 nm, a wavelength commonly used in peptide analysis.
However NAD’s primary chromophore absorbs at 260 nm, not 214 nm.
Because many unrelated molecules absorb at 214 nm, the signal at this wavelength is far less specific.
A large peak detected at 214 nm therefore does not necessarily confirm that the compound is NAD.
A Peak Appearing at t₀
Another unusual feature is that the major chromatographic peak appears very close to t₀, the point where compounds elute immediately after injection.
Compounds that elute at t₀ typically have little interaction with the column, meaning they are not being effectively separated.
When that happens, the peak may represent multiple co-eluting compounds, making purity calculations unreliable.
Mass Spectrometry Does Not Fully Resolve the Issue
The report includes a mass spectrum showing an ion at m/z ≈ 663, corresponding to the protonated molecule [M+H]^+.
However nucleotide spectra often show sodium adducts such as [M+Na]^+, which are absent here.
This does not prove the compound is not NAD, but it adds to the uncertainty created by the chromatographic method.
Modern HPLC systems often use diode-array detectors capable of recording multiple wavelengths simultaneously. However, the wavelength reported on the certificate of analysis still determines how the chromatogram is interpreted, and in this case the reported detection wavelength was 214 nm
Case 2; When Two Labs Disagree on Identity, Not Just Purity
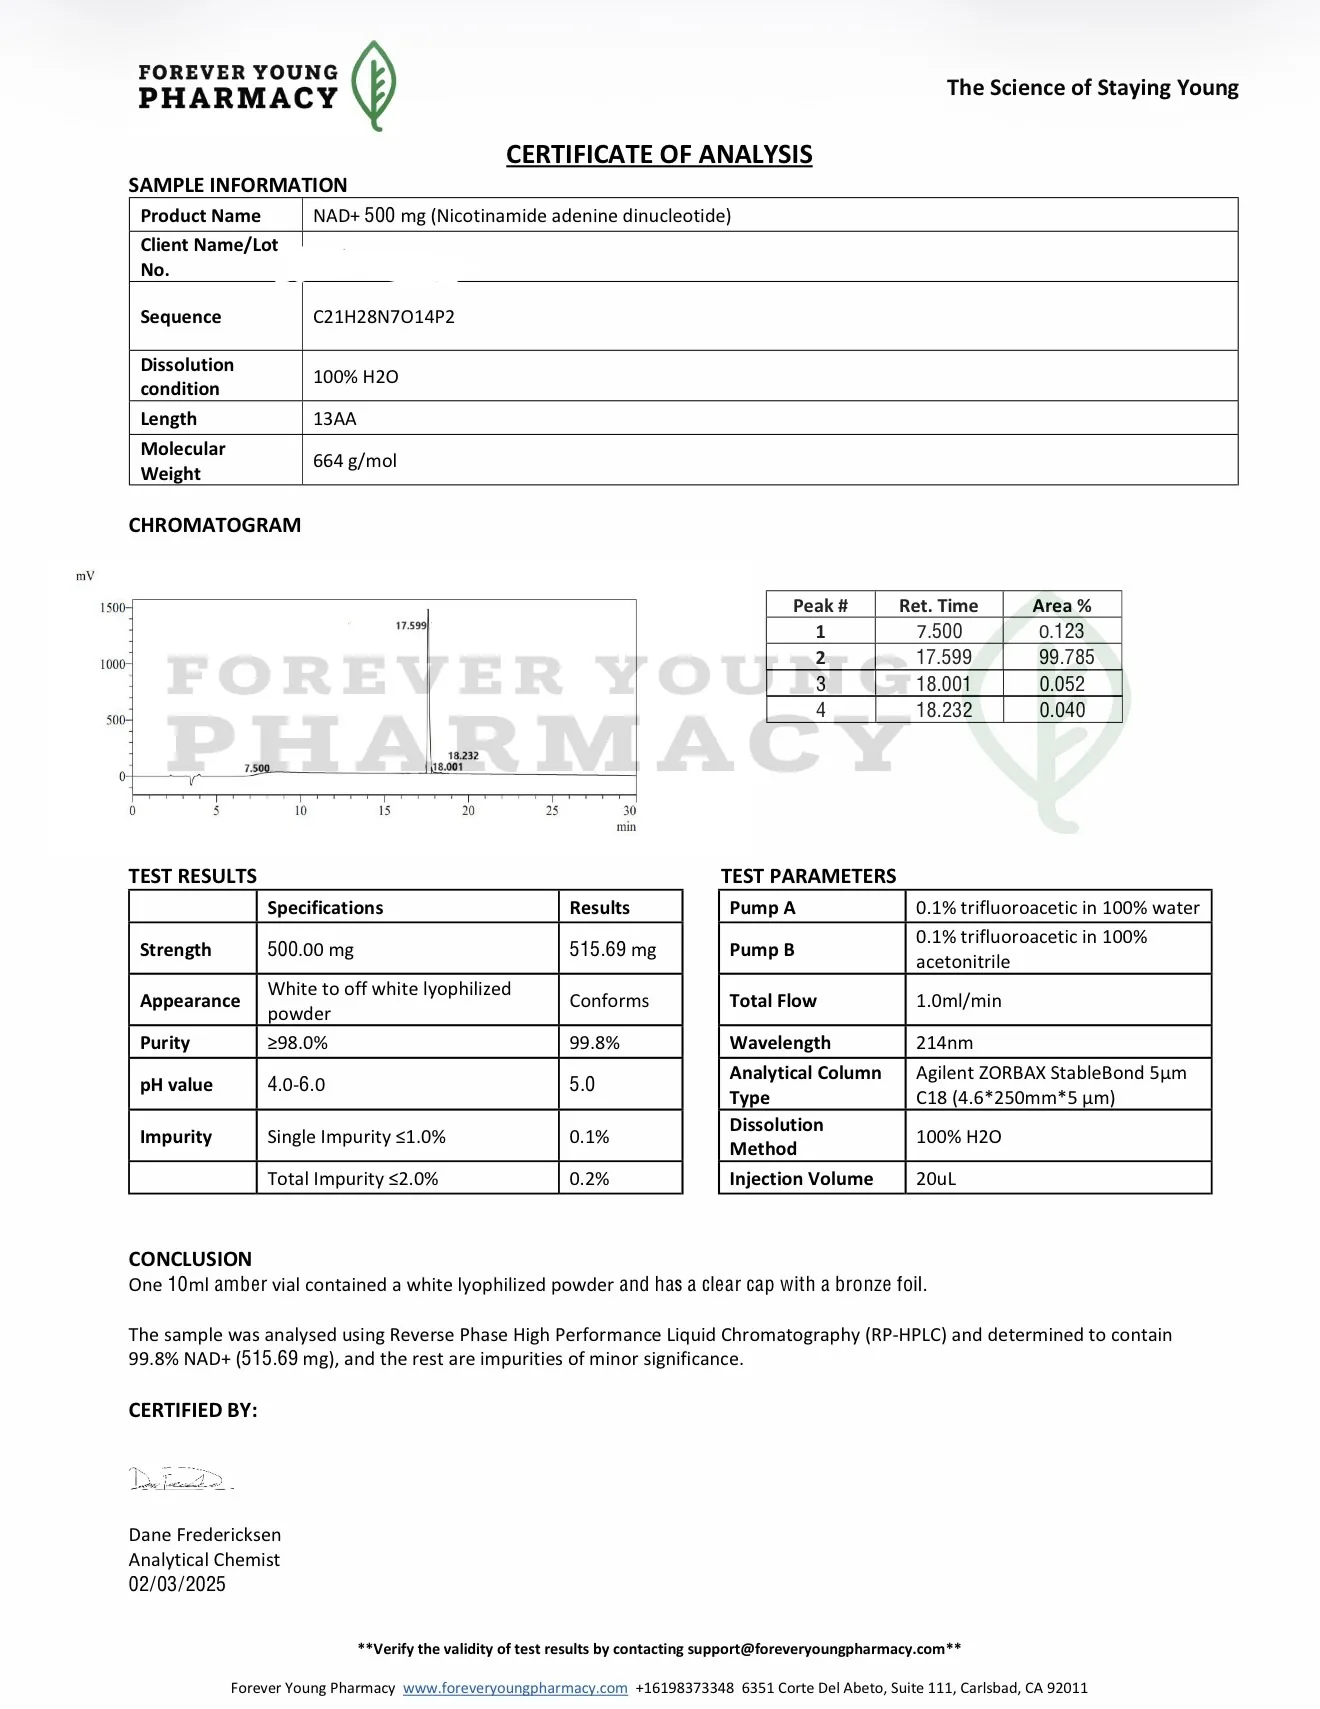
In another case, two laboratories examined the same sample and did not merely disagree on purity, they disagreed on identity.
Forever Young Pharmacy reported a highly pure NAD result.
Another ( Janoshik) concluded the material was not NAD+ at all.
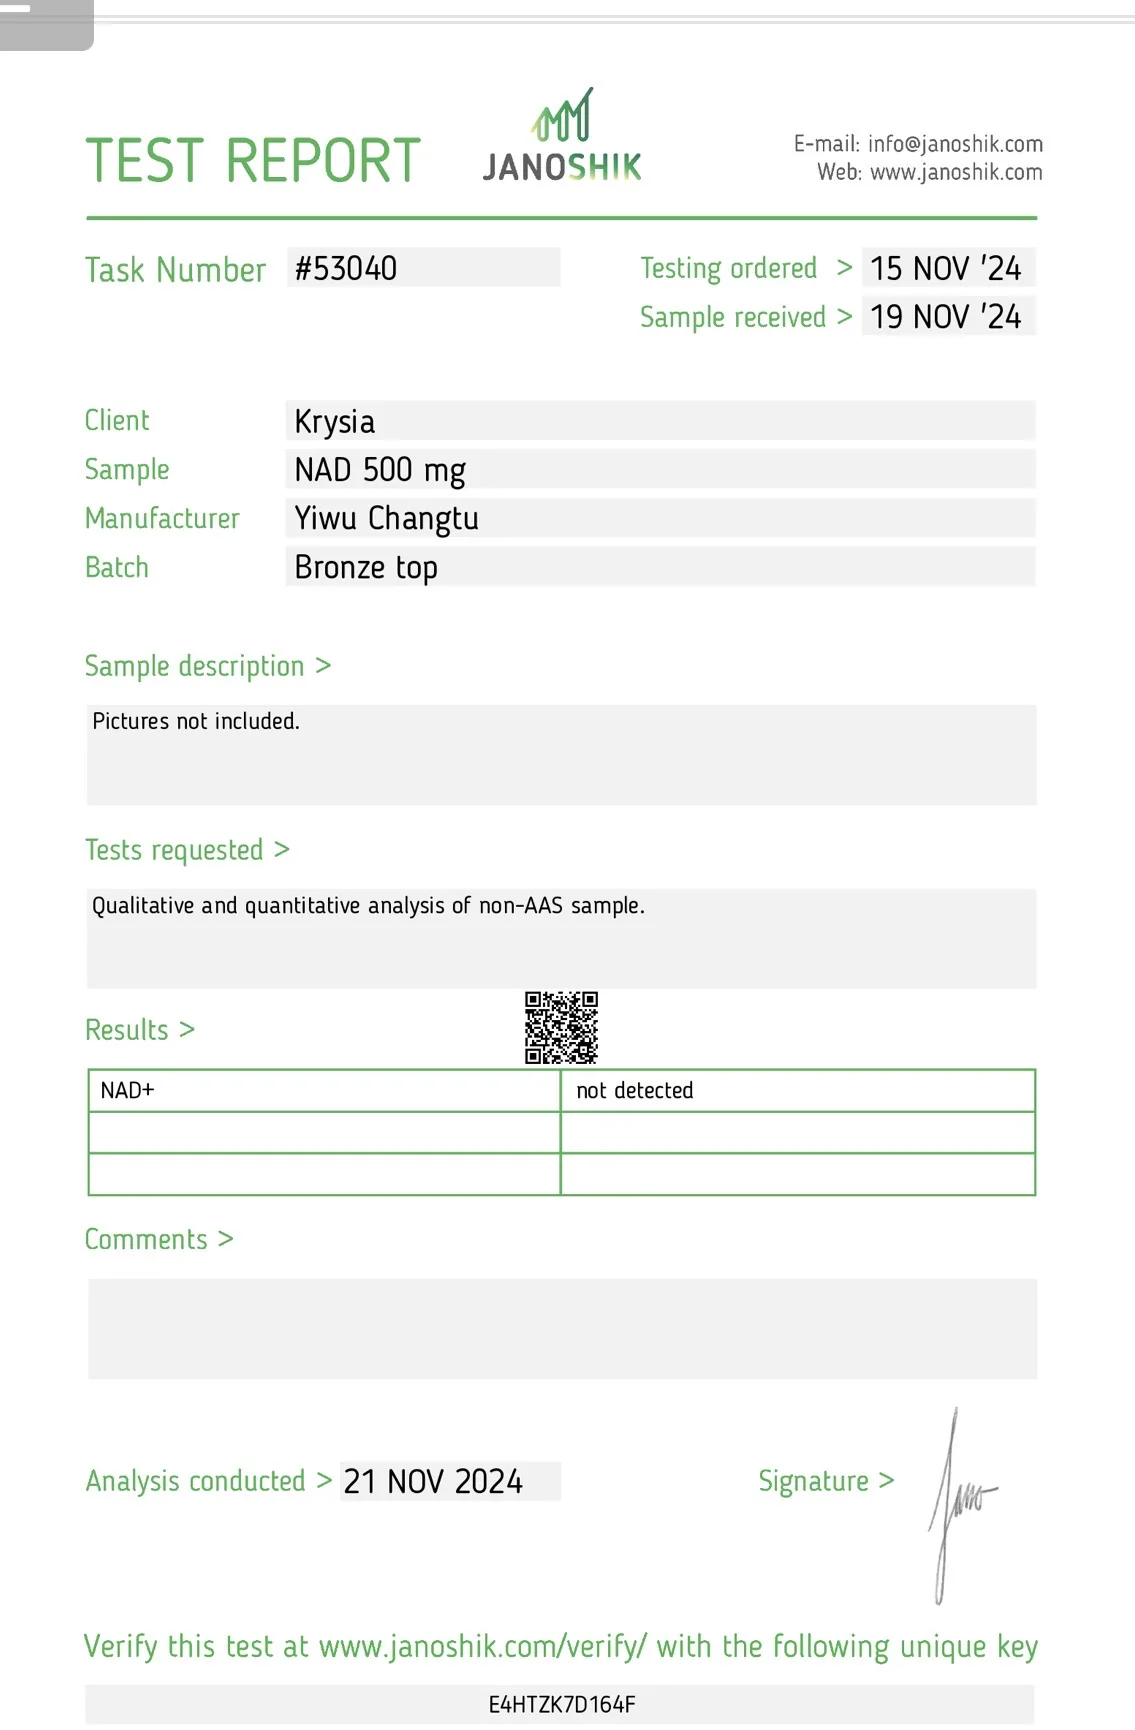
According to the discussion, the sample showed a molar mass of approximately 668 Da, but Janoshik stated they were “100% sure it is not NAD+.”
In this case the disagreement was not simply about purity, it was about identity.
One laboratory reported a highly pure NAD result.
Another concluded the material was not NAD+ at all.
That distinction highlights why identity confirmation is critical before any purity percentage can be interpreted.
Why Some Labs Refuse to Report NAD Purity
This is also why some laboratories refuse to report peptide style purity percentages for NAD.
In principle, purity should refer to the proportion of intact, functional NAD relative to degradation products and other impurities. However, measuring that accurately requires an analytical method capable of distinguishing NAD from the compounds it naturally degrades into.
For a finished NAD product, the challenge is therefore not that purity has no definition, but that different analytical methods may measure different aspects of the sample.
For example, a laboratory might report:
the percentage of the main chromatographic peak
the amount of intact NAD present
the proportion of molecules matching the NAD structure
the percentage that has not yet degraded
These approaches are related but not identical measurements, and depending on the analytical method used, they can produce different numerical results.
Degradation products may be chemically expected, but they are still not functional NAD and should not be counted as such in a rigorous purity calculation.
Two labs analysing the same sample may therefore produce results that appear contradictory while both believe their measurements are technically correct.
A Different Approach: Reporting Identity and Content Instead of Purity
Another NAD report illustrates a different strategy.
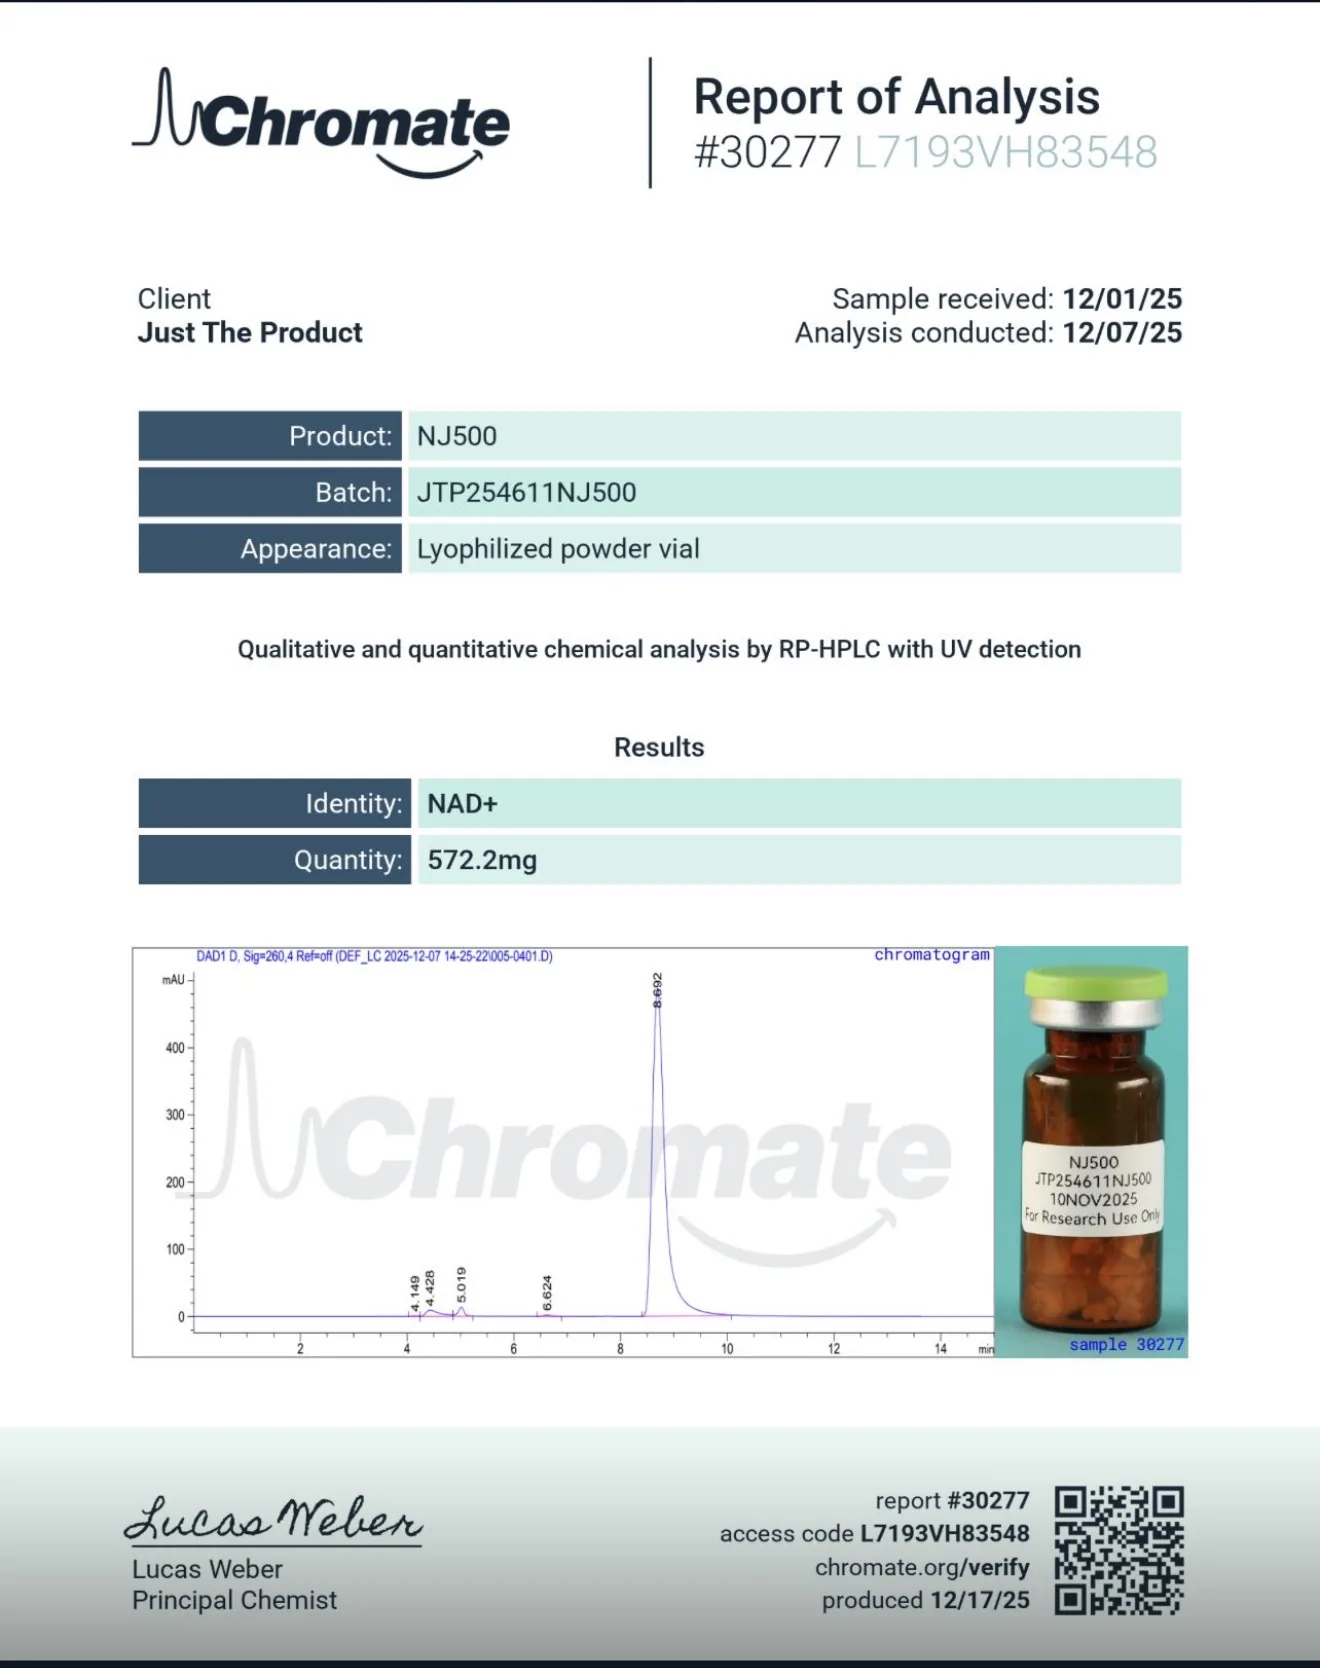
In this case the laboratory Chromate analysed a sample labelled NJ500 using RP-HPLC with UV detection.
Rather than reporting a purity percentage, the report provided two pieces of information:
Identity: NAD⁺
Quantity: 572.2 mg
In other words, the lab confirmed the identity of the molecule and measured how much NAD was present in the vial.
What it did not attempt to do was assign a single purity percentage.
This reflects the reality that NAD behaves very differently from peptides. Because the molecule can degrade into a family of related compounds with similar UV behaviour, reporting purity as a single number can be misleading without extensive method validation.
Instead, the chromatogram showed a main peak around 8 to 9 minutes, along with smaller earlier peaks consistent with related species.
This type of profile is far more consistent with the known chemistry of NAD.
A Method Designed Specifically for NAD
While some laboratories attempt to analyse NAD using peptide style methods, others have begun developing analytical approaches specifically designed for nucleotide chemistry.
One example comes from a method validation study published by Uzorak. Rather than simply running an HPLC test and reporting a purity number, the study focuses on demonstrating method selectivity, the ability of the analytical method to distinguish NAD from related compounds.
In their approach, several members of the NAD molecular family are first analysed individually to establish their characteristic retention times. These include NAD itself, as well as common degradation products such as AMP, ADP, and nicotinamide.
The resulting chromatograms show clearly separated peaks:
ADP eluting around ~3.8 minutes
AMP around ~5.1 minutes
NAD around ~7.4 minutes
Nicotinamide around ~9.1 minutes
By establishing these reference points, the laboratory can then analyse unknown samples and determine whether additional peaks correspond to known NAD degradation products or unrelated compounds.
Interestingly, the reference NAD standard used in the study shows a purity of 88.2%, with several smaller peaks corresponding to expected degradation species.
Rather than ignoring these peaks, the study explicitly recognises them as related degradation species and builds them into the method. That allows the assay to distinguish intact NAD from its breakdown products, instead of falsely treating the sample as a single clean peak.
When a real NAD sample was analysed using the same method, the calculated purity was 90.65%, and all observed impurities matched compounds within the NAD family.
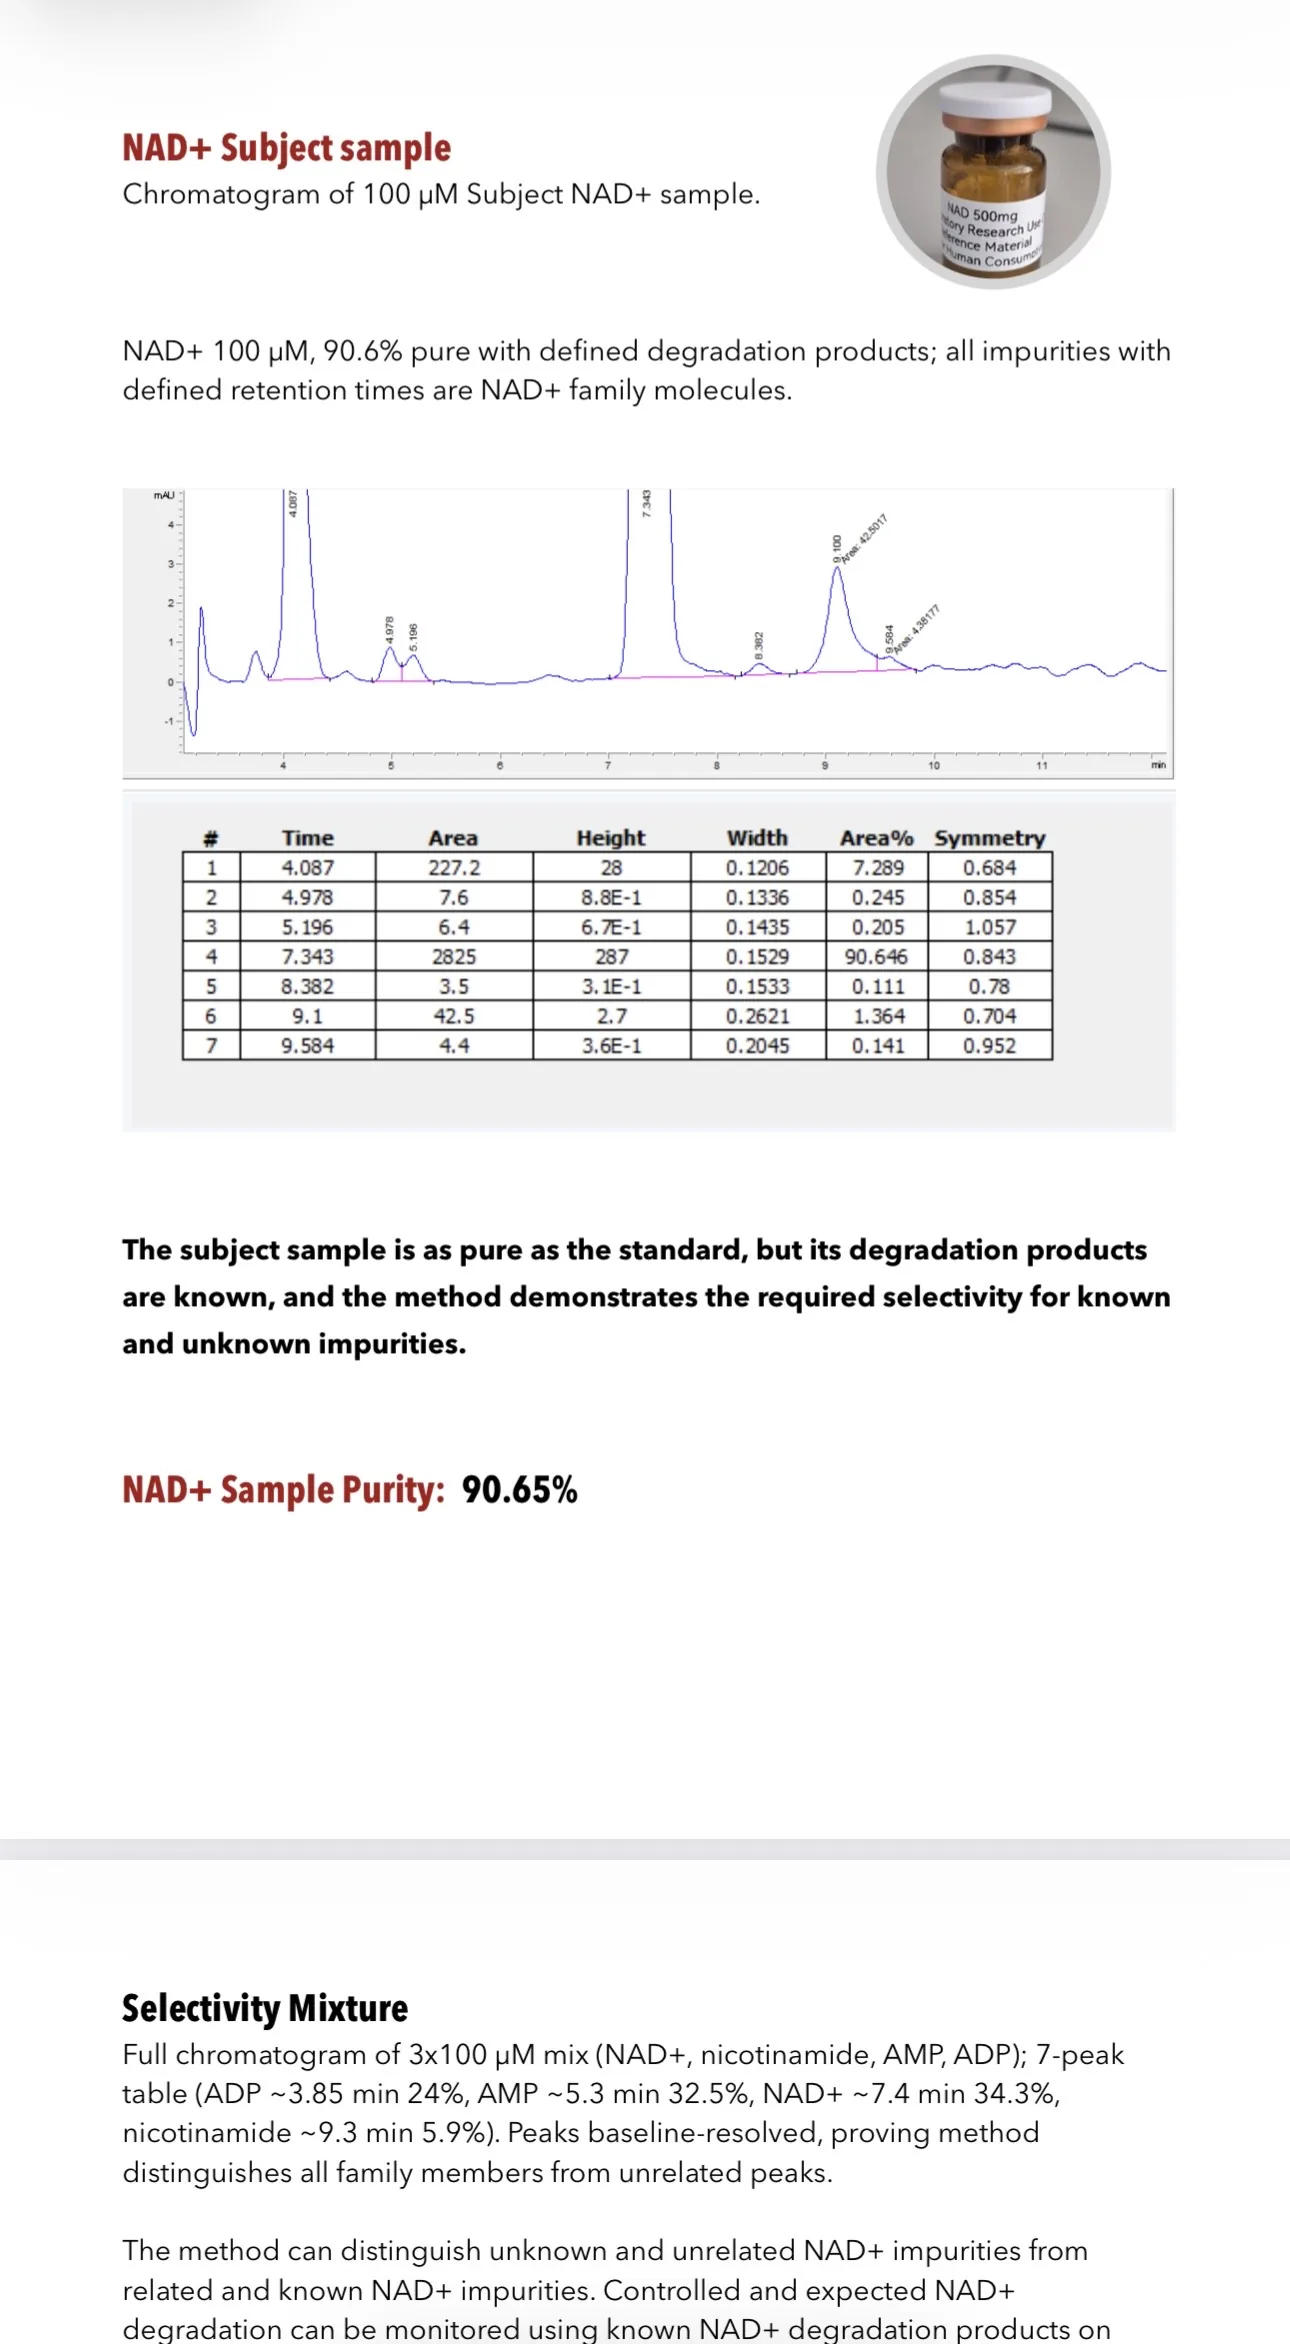
To further demonstrate the method’s reliability, the researchers ran a mixture containing NAD, AMP, ADP and nicotinamide simultaneously. The chromatogram showed all four compounds clearly separated, confirming that the method could distinguish related species from one another.
In analytical chemistry this capability is known as selectivity.
And it highlights a key point often missed in discussions of NAD purity: the goal is not simply to measure a large peak and assign a percentage, but to confirm that the analytical method can distinguish NAD from the compounds it naturally degrades into.
What Buyers Should Look For Instead
If purity is often the wrong question, what should buyers look for instead?
A useful NAD report should clarify:
what wavelength was used
whether the test relied only on UV detection or included LC-MS or NMR
whether the method was designed for nucleotides
whether related degradation products were considered
whether the reported number represents purity, identity, or content
Buyers should also consider whether the method can distinguish NAD from:
NADH
nicotinamide
ADP-ribose
AMP
ADP
If that selectivity is unclear, then the purity percentage should be treated cautiously.
In other words, buyers should stop asking only:
How high is the purity?
And start asking:
How was that number produced, and what does it actually represent?
Conclusion
The deeper I looked into NAD testing, the clearer one thing became: the problem is not simply that laboratories disagree.
The problem is that NAD is often being analysed using frameworks originally developed for peptides, where purity can reasonably be represented by a dominant chromatographic peak.
NAD behaves very differently.
It degrades into a network of related molecules.
Its UV signals can overlap with other compounds.
Its identity may require orthogonal confirmation.
That is why a “99.8%” or “99.956%” NAD result should not automatically reassure buyers.
Sometimes it may do the opposite.
Because when a molecule naturally degrades into a family of related compounds, a rigorous purity assay should distinguish intact NAD from those degradation products. The chemical profile still matters, but only because it allows true purity to be measured properly.
It is a chemical profile.
And until laboratories clearly explain what they are measuring when they report NAD purity, headline percentages should be treated with far more caution than confidence.
Comments