
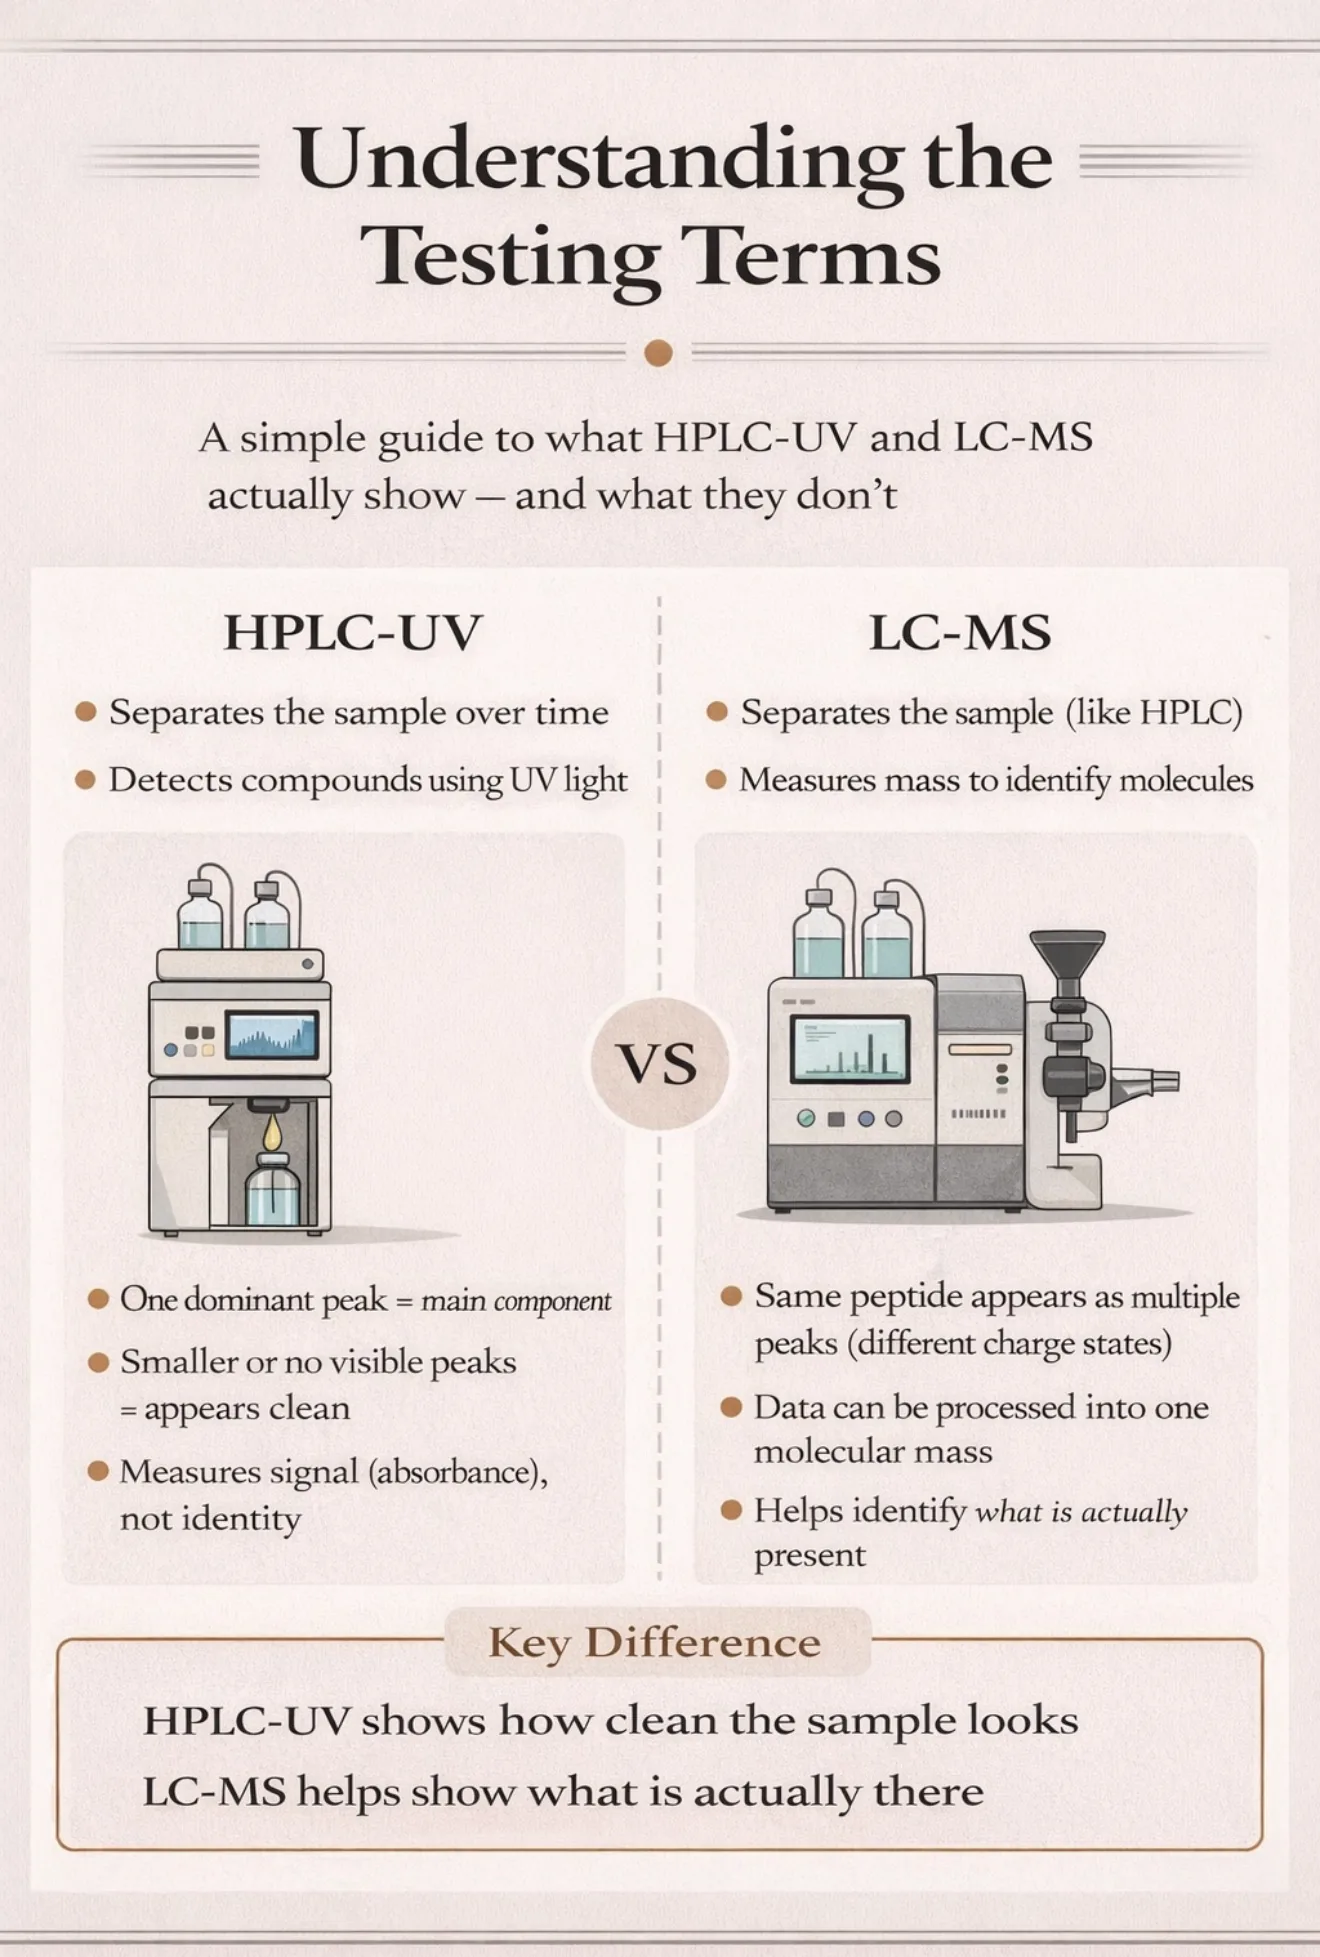
A Quick Guide to the Terms
If you spend any time at all in the grey market community, you’ll have seen terms like HPLC-UV and LC-MS thrown around constantly when people talk about testing peptides.
A lot of people use them confidently, but not everyone actually understands what they mean, or how they differ.
So I’ve decided to create an easy to understand guide to understanding what these methods involve.
They are all different analytical methods used to test peptides, but they are not interchangeable.
Each one is designed to answer a slightly different question:
some focus on purity
some focus on separation
some focus on identification
What HPLC-UV actually does
The standard test for purity is currently HPLC-UV. In simple terms this is a way of separating a mixture and then “seeing” what’s in it using light.
Step by step
1. You start with a liquid sample
The peptide is dissolved in a liquid and injected into the machine.
2. It gets pushed through a column
The liquid is forced through a long, tightly packed tube (the column).
Inside that column:
different molecules move at different speeds
based on things like size, charge, and polarity
So the mixture starts to separate out over time
3. Each component comes out at a different time
As the sample travels through the main peptide comes out at one particular time and impurities come out earlier or later
This is called retention time
Retention time is not an intrinsic property of the peptide, it depends entirely on the chromatographic method used. The same compound can elute at different times in different labs without meaning it is a different substance.
4. The UV detector “sees” them
As each component exits the column, it passes through a UV detector.
the detector shines light (usually around 220 nm for peptides)
molecules absorb that light
the machine records how much is absorbed
more absorption usually means more UV-visible material.
5. You get a chromatogram
The output is a graph that looks like peaks:
big peak = usually the main component
smaller peaks = additional components, which may be impurities
The area under each peak is used to estimate purity
What “99% purity” actually means
It usually means:
99% of the UV signal came from the main peak
NOT:
99% of the vial is perfectly pure
or that everything else in the vial has been directly measured
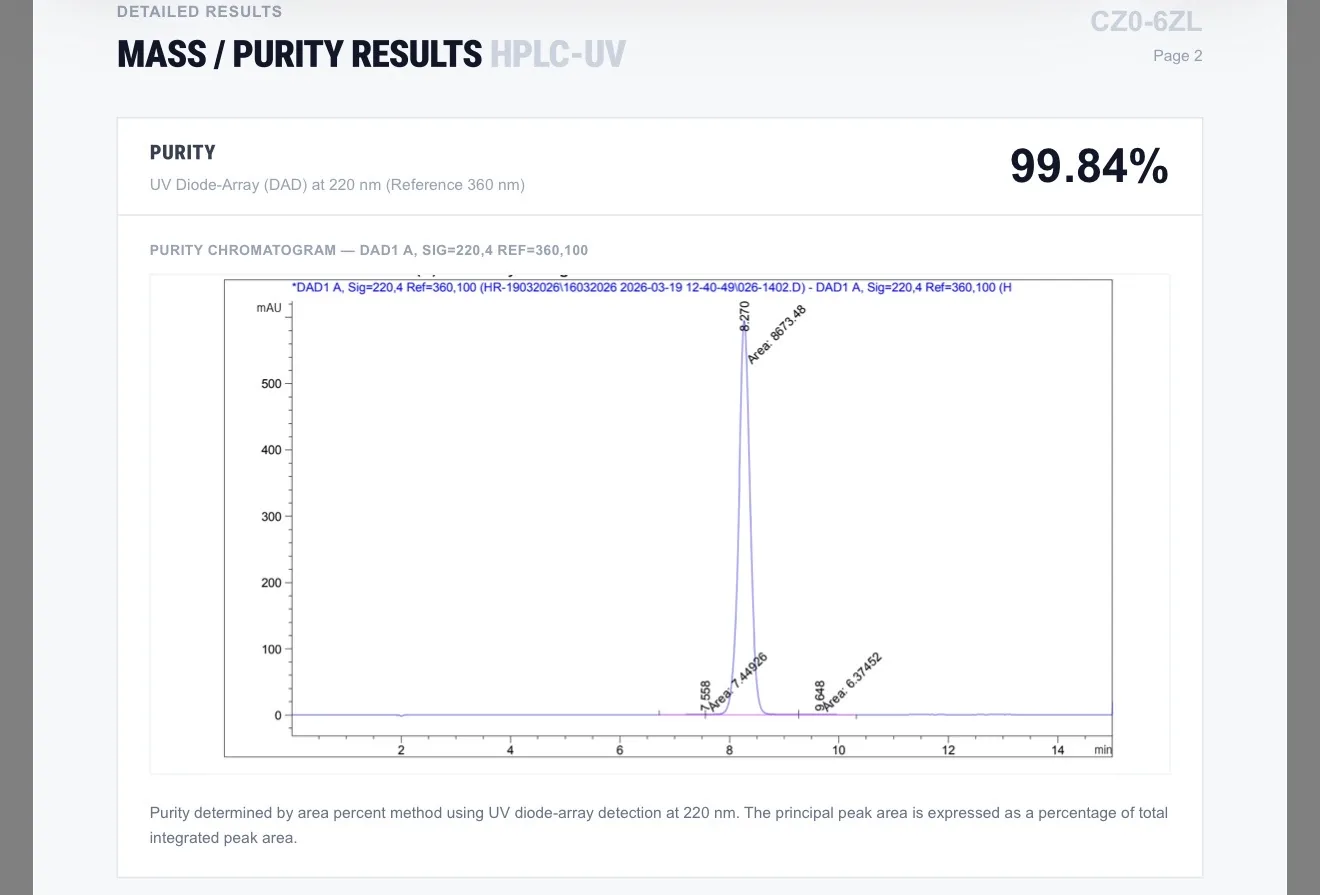
On this chromatogram:
the big tall peak around 8.27 minutes is the main peptide
the small features around 7.66 and 9.65 minutes appear as very minor signals relative to the main peak
The machine then compares the area of the main peak with the total area of all integrated peaks.
That is where the 99.84% purity figure comes from.
The key limitation
HPLC-UV can only show what it can:
separate
and detect with UV
So it can miss things if:
impurities overlap with the main peak
two substances come out at the same time
something doesn’t absorb UV well
In those cases, everything can look like one clean peak
What Doesn’t Always Show Up on an HPLC-UV Purity Test
An HPLC-UV chromatogram can look very clean, but that doesn’t mean everything in the vial is visible on the graph.
That’s because the method only detects what it is designed to see.
Excipients (buffers, stabilisers, salts)
These are substances intentionally added to the product.
Many do not absorb UV strongly
Some elute very early and are ignored
Others may not appear clearly at all
They can be present without showing up as obvious peaks
Non-UV-active compounds
HPLC-UV works by measuring light absorption.
If a compound doesn’t absorb well at the chosen wavelength:
it may appear very small
or not appear at all
Co-eluting compounds
Different molecules can come out at the same time.
When that happens:
they merge into a single peak
the detector sees them as one signal
Very small peaks
Some methods ignore peaks below a certain threshold.
In this case:
That means tiny signals may not be counted in the purity result.
Non-peptide contaminants
Some contaminants, especially unusual ones, may:
not absorb UV strongly
behave differently in the column
These may be better detected by LC-MS than UV
What LC-MS actually does
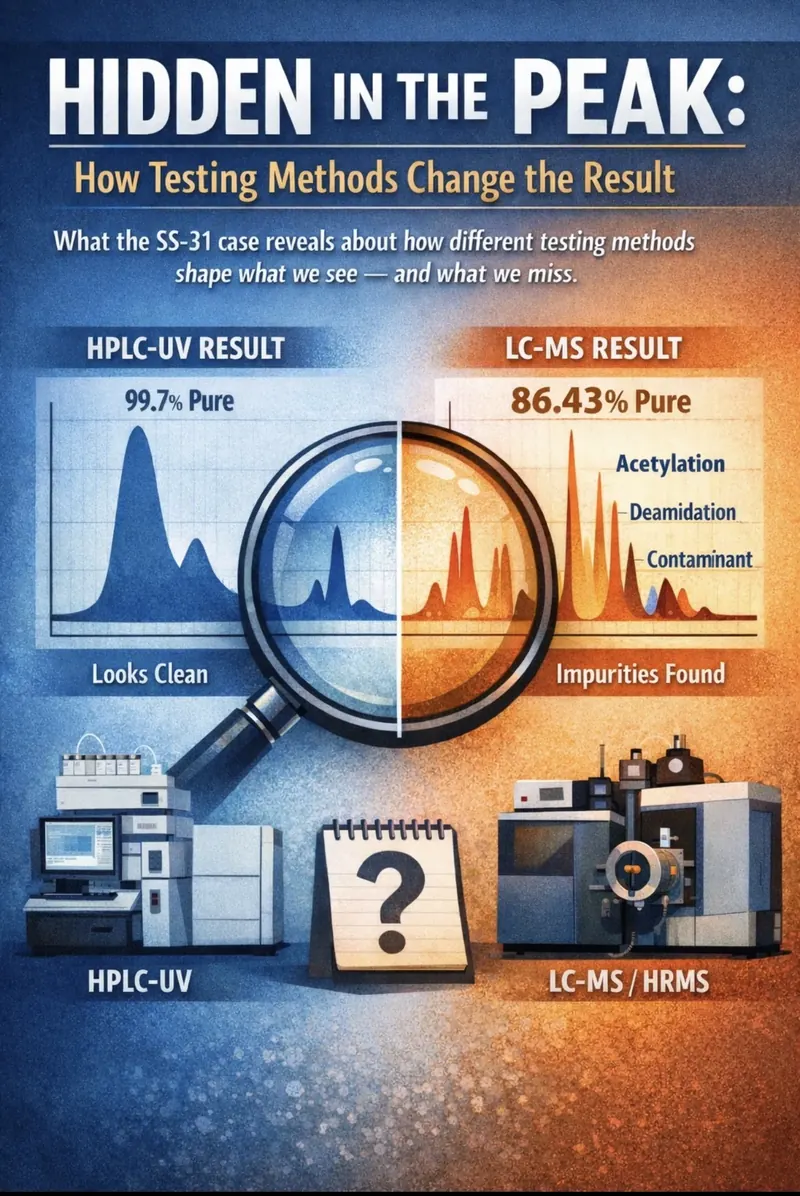
LC-MS separates a mixture like HPLC, but instead of just “seeing” it with light, it weighs the molecules to identify what they are.
Step by step
1. Same start as HPLC
The sample is injected and pushed through a column.
It still gets separated over time into different components.
2. Instead of UV, it goes into a mass spectrometer
As each component comes out of the column, it enters the mass spectrometer.
Inside, molecules are
turned into charged particles (ions)
measured based on their mass-to-charge ratio
This gives a very specific “fingerprint” of each molecule
3. It can help identify what each peak represents
Instead of just seeing a peak, LC-MS can tell you:
this is the main peptide
this is a modified version (e.g. acetylated)
this is a fragment
this is something else entirely
MS Identity Confirmation
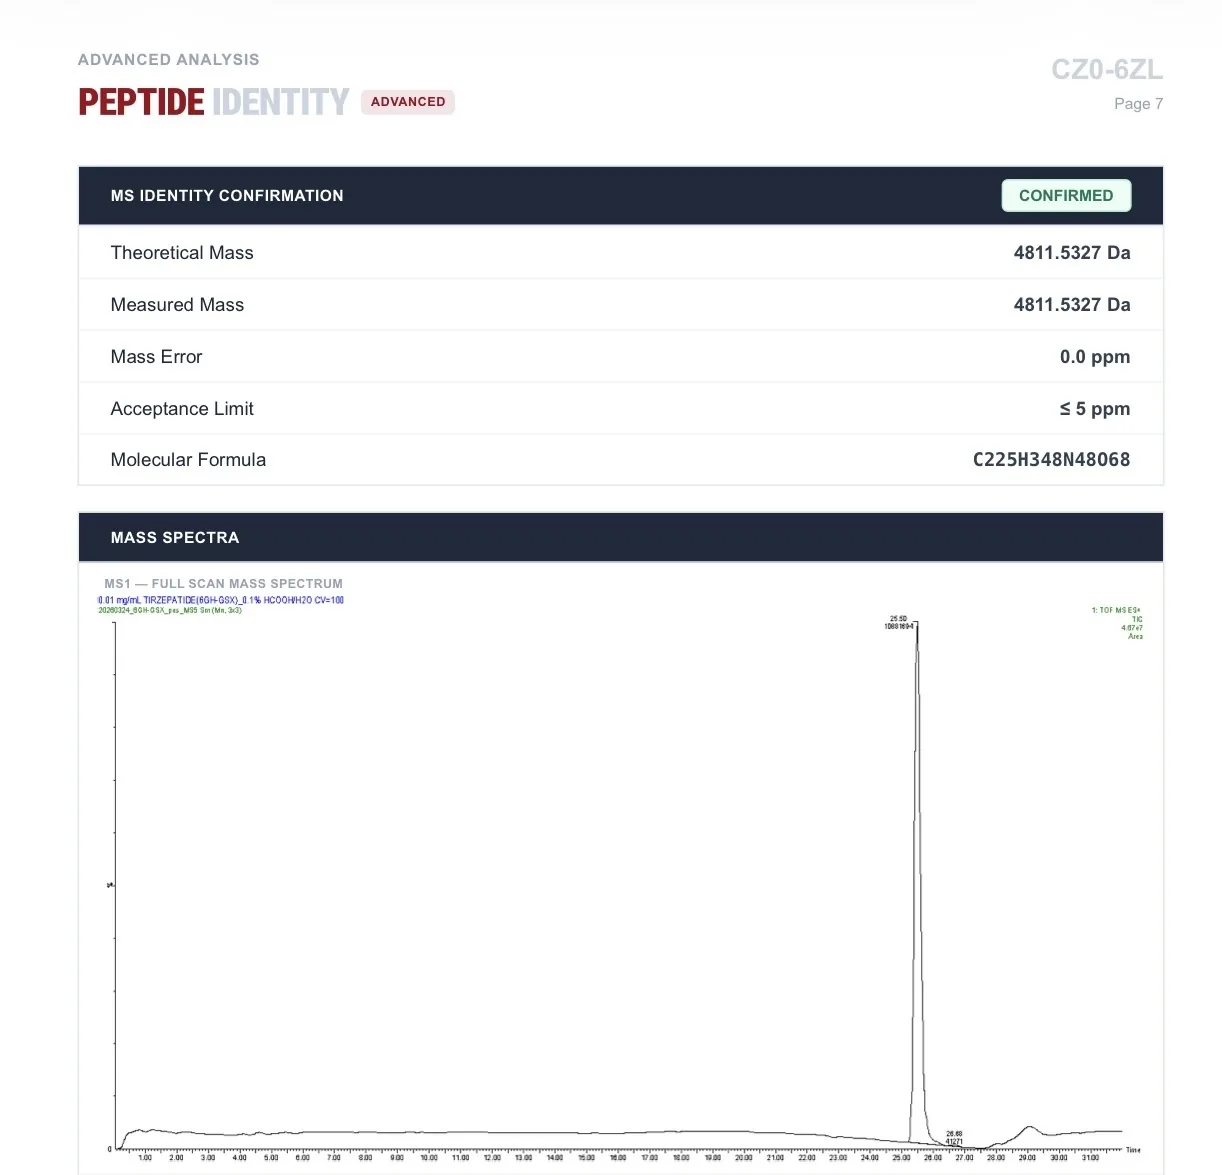
Main graph (MS1 spectrum)
This is the mass spectrum.
X-axis = mass/charge (m/z)
Y-axis = signal intensity
The big peak = the peptide signal
This shows:
the peptide is present
at the correct mass
Theoretical mass: 4811.5327 Da
what the peptide should weigh
Measured mass: 4811.5327 Da
what the instrument actually measured
Mass error: 0.0 ppm
essentially a perfect match
Acceptance limit: ≤ 5 ppm
allowed tolerance
Status: CONFIRMED
What that means:
The molecule detected matches the expected tirzepatide peptide very precisely
This confirms identity, not purity. It shows that the main compound has the correct mass and structure, but it does not tell you how clean the sample is or what other compounds may be present alongside it.
This is a simplified explanation of complex analytical methods, but it captures the key differences that matter for this discussion.
But LC-MS is not perfect
It’s powerful, but it still has limitations.
signal intensity does not equal exact quantity
different molecules ionise differently
some compounds can share the same mass
interpretation is still required
It reveals more detail, but that detail still needs to be interpreted carefully
Below is an example from Krause Lab showing HPLC-UV ( top graph) and Mass Spectrum ( bottom graph) of > 99.9% tirzepatide
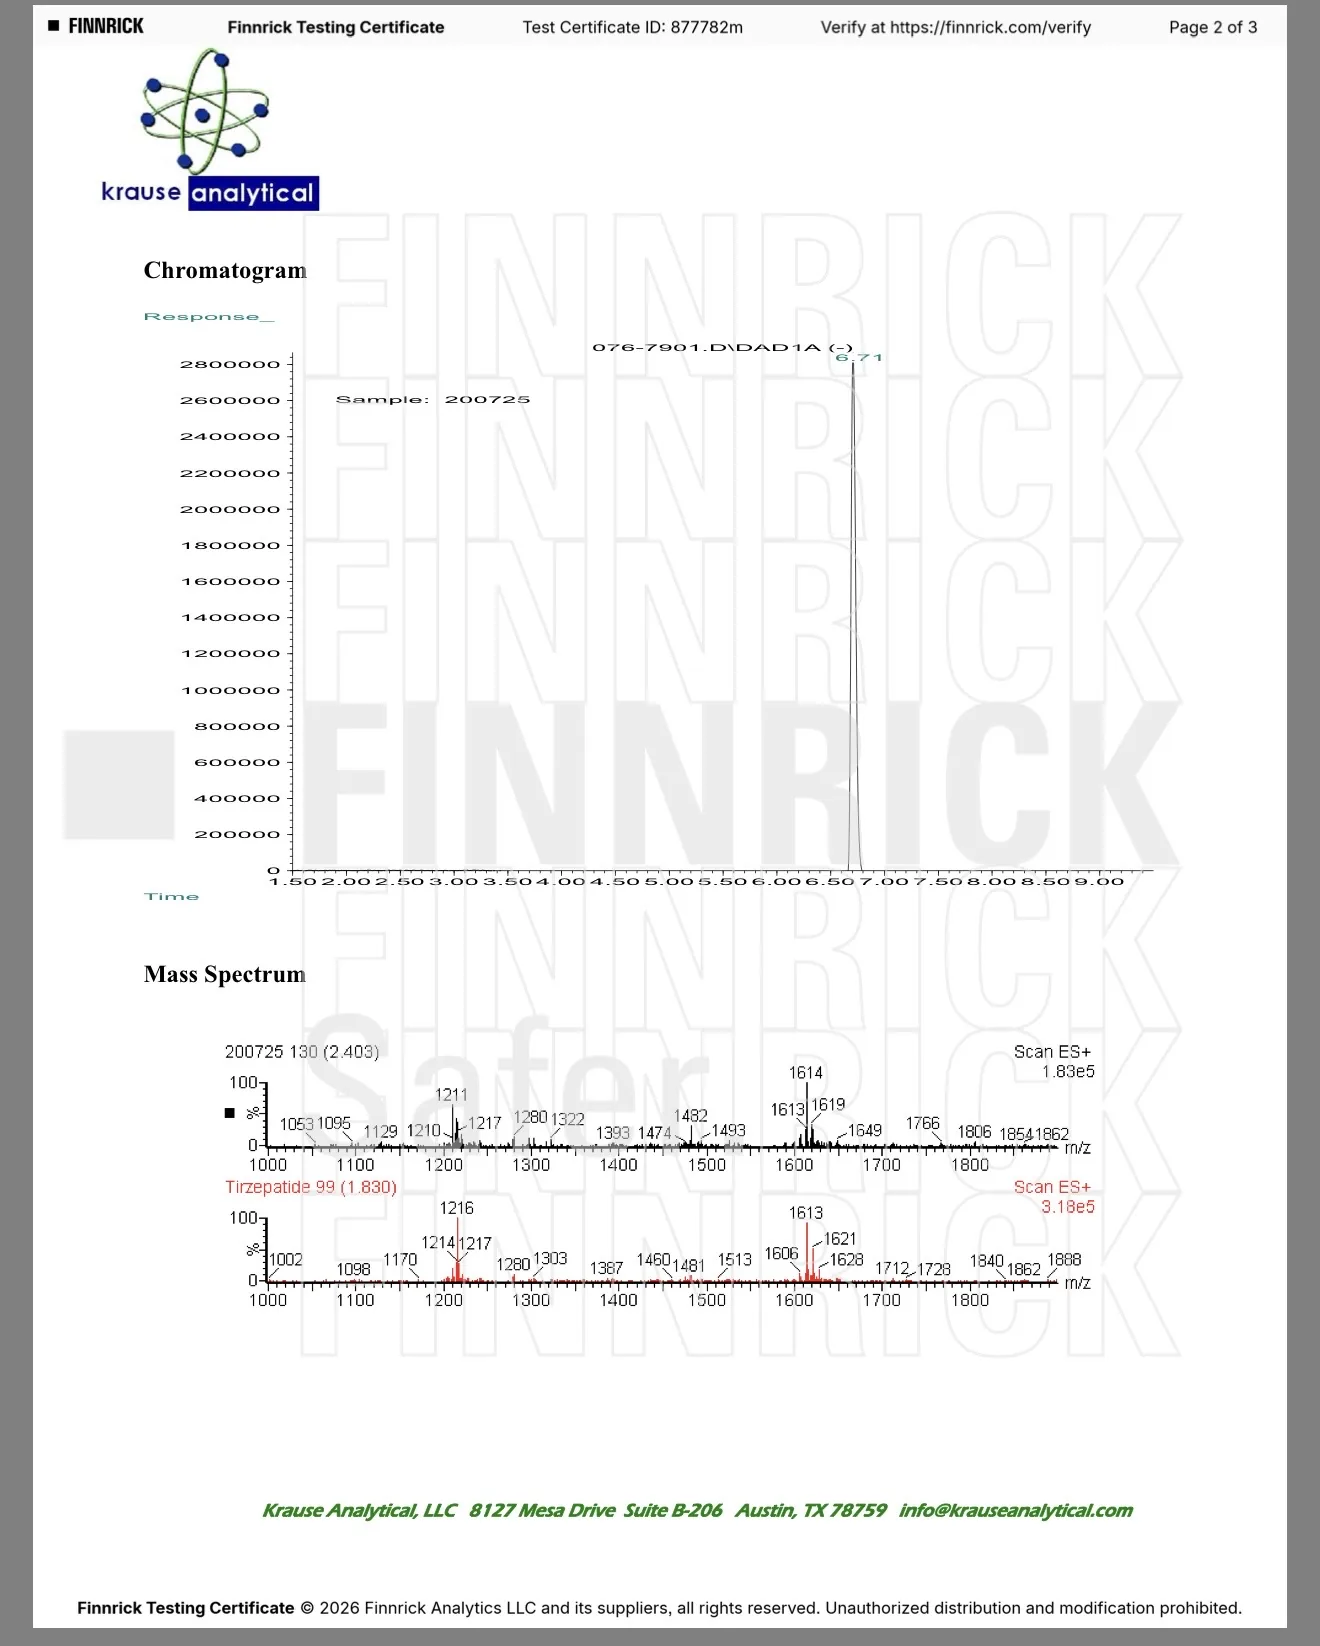
The Krause HPLC chromatogram shows a single sharp peak with no clearly visible secondary peaks, suggesting that one compound dominates the sample under this method.
The bottom graph shows the raw mass spectrum, where the peptide appears as multiple peaks due to different charge states.
Uzorak’s report presents a deconvoluted result, where those peaks are mathematically combined into a single molecular mass. Both are based on the same underlying principle, but the results are processed and displayed differently.
Krause lab: raw LC-MS
m/z →
1000 1200 1400 1600 1800
▲ ▲ ▲ ▲
+5 +4 +3 +2
Same molecule, different charge states
Uzorak lab: deconvoluted LC-MS
Those charge states combined into one molecular mass
Molecular mass:
▲
|
4811.53 Da
All charge states combined into one value
This is the actual molecular weight
Conclusion
There isn’t one “best” test.
There are different tools, each designed to show a different part of the picture.
HPLC-UV shows what you can see.
LC-MS helps show what’s actually there.
The key isn’t choosing one over the other, it’s understanding what each one is really telling you.
Comments